MASTER MINDS
No.1 for CA/CWA & MEC/CEC
17. BUDGETARY CONTROL
SOLUTIONS TO ASSIGNMENT PROBLEMS
Problem No. 1
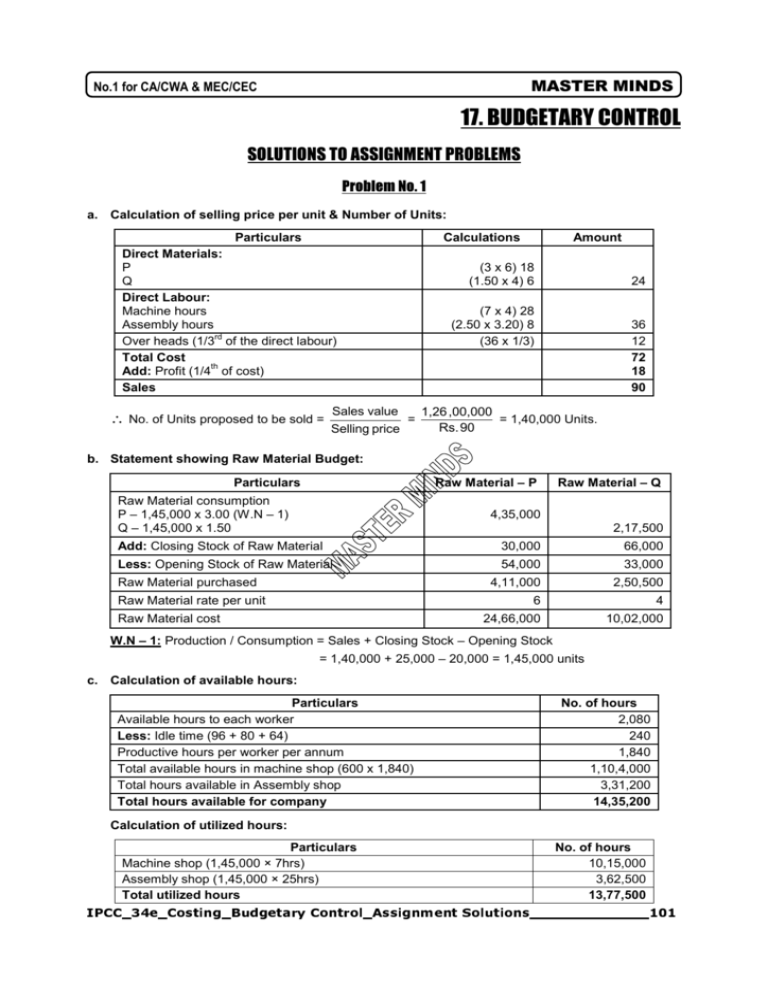
a. Calculation of selling price per unit & Number of Units:
Particulars
Direct Materials:
P
Q
Direct Labour:
Machine hours
Assembly hours
rd
Over heads (1/3 of the direct labour)
Total Cost
th
Add: Profit (1/4 of cost)
Sales
∴ No. of Units proposed to be sold =
Calculations
Amount
(3 x 6) 18
(1.50 x 4) 6
24
(7 x 4) 28
(2.50 x 3.20) 8
(36 x 1/3)
36
12
72
18
90
Sales value
1,26 ,00,000
= 1,40,000 Units.
=
Rs. 90
Selling price
b. Statement showing Raw Material Budget:
Particulars
Raw Material – P
Raw Material consumption
P – 1,45,000 x 3.00 (W.N – 1)
Q – 1,45,000 x 1.50
Raw Material – Q
4,35,000
2,17,500
Add: Closing Stock of Raw Material
30,000
66,000
Less: Opening Stock of Raw Material
54,000
33,000
4,11,000
2,50,500
Raw Material purchased
Raw Material rate per unit
Raw Material cost
6
4
24,66,000
10,02,000
W.N – 1: Production / Consumption = Sales + Closing Stock – Opening Stock
= 1,40,000 + 25,000 – 20,000 = 1,45,000 units
c. Calculation of available hours:
Particulars
Available hours to each worker
Less: Idle time (96 + 80 + 64)
Productive hours per worker per annum
Total available hours in machine shop (600 x 1,840)
Total hours available in Assembly shop
Total hours available for company
No. of hours
2,080
240
1,840
1,10,4,000
3,31,200
14,35,200
Calculation of utilized hours:
Particulars
Machine shop (1,45,000 × 7hrs)
Assembly shop (1,45,000 × 25hrs)
Total utilized hours
No. of hours
10,15,000
3,62,500
13,77,500
IPCC_34e_Costing_Budgetary Control_Assignment Solutions_____________101
Ph:
98851 25025/26
www.mastermindsindia.com
10,15,000
x 100 = 91. 94%
11,04,000
3,62,500
x 100 =109%
Assembly shop utilization =
3,31,200
Machine shop utilization =
Total capacity utilization =
13,77,500
Copy Rights Reserved
To
MASTER MINDS, Guntur
x 100 = 95. 98%
14,35,200
Comments:
1. In the Machine shop, utilization ratio is nearly 92% i.e, 8% is treated as normal idle time or normal loss.
2. In the Assembly shop, utilization ratio is nearly 109% i.e, overtime, it is a good sign to the company.
3. In case of overall company, utilization ratio is 96% i.e, 4% is treated as normal loss.
Problem No. 2
a. Production bedjet showing month wise number of units to be manufactured:
Gamma:
Sales
Add: closing stock
Less: closing stock
production
Apr
900
550
450
1000
May
1100
700
550
1250
June
1400
900
700
1600
July
1800
1100
900
2000
Aug
2200
1100
1100
2200
July
2100
850
1050
1900
Aug
1700
850
850
1700
Sep
2200
900
1100
2000
Total
10050
Delta:
Sales
Add: closing stock
Less: closing stock
production
Apr
2900
1450
1450
2900
May
2900
1250
1450
2700
June
2500
1050
1250
2300
Sep
1700
950
850
1800
Total
13300
b. Production cost budget for the half year:
Gamma
Direct material
Direct labour
Moh
Delta
Total
50
20
80
30
2,00,000
20,000
3,75,000
25,000
10
Cost per unit
Production
Production cost
15
80
10,050
8,04,000
125
13,300
16,62,500
24,66,500
Problem No. 3
(i) Production Budget for the year 2012 by Quarters
I
Sales demand(Unit)
18000
II
22000
III
IV
25000
27000
Total
92000
IPCC_34e_Costing_Budgetary Control_Assignment Solutions ____________102
MASTER MINDS
No.1 for CA/CWA & MEC/CEC
I
Opening Stock
6000
7200
8100
8700
30000
II
70% of Current
Quarter ‘s
Demand
12600
15400
17500
18900
64400
III
30% of Following
Quarter’s Demand
6600
7500
8100
7400*
29600
IV
Total Production(II
&III)
19200
22900
25600
26300
94000
V
Closing Stock (I+IVSales)
7200
8100
8700
8000
32000
*Balancing Figure
(ii) Break Even Point = Fixed Cost/ PV Ratio
= 220000/13.75% = 1600000 or 40000 units.
P/V Ratio = (40 - 34.50 = 5.50)/40 × 100 =13.75%
(Or, Break Even Point= Fixed Cost/ Contribution = 2,20,000/5.50 = 40,000 Units)
Total sales in the quarter II is 40000 equal to BEP means BEP achieved in II quarter.
Problem No. 4
(i) Production Budget for January to March 2009 (Quantitative):
Budgeted Sales
Add: Budgeted Closing Stock (20%
of sales of next month)
Less: Opening Stock
Budgeted Output
Jan
10,000
Feb
12,000
Mar
14,000
April
15,000
2,400
12,400
2,700
9,700
2,800
14,800
2,400
12,400
3,000
17,000
2,800
14,200
3,000
18,000
3,000
15,000
Total Budgeted Output for the Quarter ended March 31, 2009 = (9,700 + 12,400 + 14,200) = 36,300
units.
(ii) Raw Material Consumption Budget (in quantity):
Month
Jan
Feb
Mar
Apr
Total
Budgeted Output
(Units)
9,700
12,400
14,200
15,000
Material ‘X’ @ 4 kg
per unit (Kg)
38,800
49,600
56,800
60,000
2,05,200
Material ‘Y’ @ 6 kg
per unit (Kg)
58,200
74,400
85,200
90,000
3,07,800
(iii) Raw Materials Purchase Budget (in quantity) for the Quarter ended
(March 31,2009):
Raw material required for production
Add: Closing Stock of raw material
Less: Opening Stock of raw material
Material X (kg)
1,45,200
30,000
1,75,200
19,000
Material Y (kg)
2,17,800
45,000
2,62,800
29,000
IPCC_34e_Costing_Budgetary Control_Assignment Solutions_____________103
Ph:
98851 25025/26
www.mastermindsindia.com
1,56,200
Material to be purchased
2,33,800
Problem No. 5
Working Note :
1. Statement showing contribution:
Sub assemblies
ABC
Selling price per 520
unit (p.u.) : (A)
Marginal Cost p.u.
Components
60
Base board
IC08
160
IC12
48
IC261
6
Labour
Grade A
40
Grade B
64
Variable
36
production
overhead
Total
marginal 424
cost p.u. : (B)
Contribution p.u. : 96
(C) = (A) – (B)
Sales ratio : (D)
3
Contribution
× 288
Sales ratio : [(E) =
(C) × (D)]
MCB
500
DP
350
60
60
40
120
48
40
48
64
30
48
24
20
32
24
370
288
130
62
4
520
2
124
Total
932
2. Desired Contribution for the forthcoming month December, 2012
Rs.
Fixed overheads
7,57,200
Desired profit
12,00,000
Desired contribution
19,57,200
3. Sales mix required i.e. number of batches for the forthcoming month December, 2012
Sales mix required =Desired contribution/contribution × Sales ratio
=` 19,57,200/932 (Refer to Working notes 1 and 2)
= 2,100
Budgets for December, 2012
(i) Sales budget in quantity and value
Sub-assemblies
ACB
MCB
DP
Total
Sales
(quantity) 6,300
8,400
4,200
(2,100 × 3:4:2)
(Refer to working
note 3)
Selling price p.u. 520
500
350
(` )
Sales value (` )
32,76,000
42,00,000
14,70,000
89,46,000
(ii) Production budget in quantity
Sub-assemblies
ACB
Sales
6,300
Add : Closing stock 720
(Opening stock less
10%)
Total quantity required
7,020
MCB
8,400
1,080
DP
4,200
2,520
9,480
6,720
IPCC_34e_Costing_Budgetary Control_Assignment Solutions ____________104
MASTER MINDS
No.1 for CA/CWA & MEC/CEC
Less : Opening stock
Production
800
6,220
1,200
8,280
(iii) Component usage budget in quantity
Sub-assemblies
ACB
MCB
Production
6,220
8,280
Base board (1 6,220
8,280
each)
Component IC08 49,760 (6,220 × 8) 16,560 (8,280 ×
(8 : 2 : 2)
2)
Component IC12 24,880 (6,220 × 4) 82,800 (8,280 ×
(4 : 10 : 4)
10)
Component IC26 12,440 (6,220× 2) 49,680 (8,280 × 6)
(2 : 6 : 8)
(iv) Component Purchase budget in quantity and value
SubBase board
IC08
IC12
assemblies
Usage
in 18,420
74,160
1,23,360
production
Add : Closing 1,440
1,080
5,400
stock (Opening
stock
less
10%)
19,860
75,240
1,28,760
Less : Opening
stock
Purchase
(Quantity)
Purchase price
(` )
Purchase
value (` )
2,800
3,920
DP
3,920
3,920
Total
18,420
7,840 (3,920 × 2)
74,160
15,680 (3,920 × 4)
1,23,360
31,360 (3,920 × 8)
93,480
IC26
Total
93,480
3,600
97,080
1,600
1,200
6,000
4,000
18,260
74,040
1,22,760
93,080
60
20
12
8
10,95,600
14,80,8 00
14,73,120
7,44,640
47,94,160
(v) Manpower budget showing the number of workers and the amount of wages
Payable
Direct labour hour
Grade A
Grade B
Sub
Budgeted
Hours per Total hours
Hours per Total hours
assemblies
production
unit
unit
ACB
6,220
8
49,760
16
99,520
MCB
8,280
6
49,680
12
99,360
DP
3,920
4
15,680
8
31,360
(A) Total hours
(B) Hours per man per
month
(C) Number of workers
per month : (A/B)
(D) Wage rate per
month (` )
(E) Wages payable (` ) :
(C × D)
1,15,120
200
2,30,240
200
576
1,152
1,000
800
5,76,000
9,21,600
Total
14,97,600
Problem No. 6
Flexible budget at 70% capacity:
IPCC_34e_Costing_Budgetary Control_Assignment Solutions_____________105
Ph:
98851 25025/26
www.mastermindsindia.com
Particulars
Variable cost:
Material
Labour
FOH
AOH
Per unit
70% capacity(7000 units)
500 X 102% = 510
150
90
50
800
Total
Fixed cost:
FOH
AOH
Total(A)
Sales(B)
56,00,000
3,00,000
2,50,000
61,50,000
68,60,000
5,000 units X 60
5,000 units X 50
7,000 units X (1,000-2%)
7,10,000
Profit(B-A)
Problem No. 7
Head of Account
Budgeted hours
Variable expenses
Semi-variable expenses
Fixed expenses
Total expenses
Recovery rate per hour
Control basis
V
SV
F
70%
7,000
1,260
1,200
1,800
4,260
0.61
80%
8,000
1,440
1,200
1,800
4,440
0.55
90%
9,000
1,620
1,320
1,800
4,740
0.53
100%
10,000
1,800
1,440
1,800
5,040
0.50
We notice that the recovery rate at 70% activity is Rs. 0.61 per hour. If in a particular month the Factory
works 8,000 hours, it will be incorrect to estimate the allowance as Rs. 4,880 @ Rs. 0.61. The correct
allowance will be Rs. 4,440 as shown in the table. If the actual expenses are Rs. 4,500 for this level of
activity, the company has not saved any money but has over-spent by Rs. 60 (Rs. 4,500 – Rs. 4,440).
Problem 8
Flexible Budget of Department....of Company ‘X’
Expenses
(1)
Sales
Administration costs:
Office salaries
General expenses
Depreciation
Rates & taxes
Total administration costs
Selling costs :
Salaries
Travelling expenses
Sales office expenses
General expenses
Total selling costs :
Distribution costs :
Basis
(2)
6,00,000
80%
(`)
(3)
6,75,000
Level of activity
90%
100%
(`)
(`)
(4)
(5)
7,50,000
8,25,000
Fixed
2% of sales
Fixed
Fixed
1,18,250
90,000
12,000
7,500
8,750
1,19,750
90,000
13,500
7,500
8,750
1,21,250
90,000
15,000
7,500
8,750
1,22,750
90,000
16,500
7,500
8,750
8% of sales
2% of sales
1% of sales
1% of sales
48,000
12,000
6,000
6,000
72,000
54,000
13,500
6,750
6,750
81,000
60,000
15,000
7,500
7,500
81,000
66,000
16,500
8,250
8,250
99,000
110%
(`)
(6)
IPCC_34e_Costing_Budgetary Control_Assignment Solutions ____________106
MASTER MINDS
No.1 for CA/CWA & MEC/CEC
Wages
Rent 1% of sales
Other expenses
Total Distribution Cost
Total Admn., Selling & Dist.
Costs
Wages
6,000
4% of sales
15,000
6,750
24,000
45,000
2,35,250
15,000
7,500
27,000
48,750
2,49,500
15,000
8,250
30,000
52,500
2,63,750
15,000
33,000
56,250
2,78,000
Note: In the absence of information it has been assumed that office salaries, depreciation, rates and
taxes and wages remain the same at 110% level of activity also. However, in practice some of these
costs may change if present capacity is exceeded.
Problem 9
ABC Ltd.
Budget for 85% capacity level for the period 2013-14
Budgeted production (units)
Direct Material (note 1)
Direct Labour (note 2)
Variable factory overhead (note 3)
Variable selling overhead (note 4)
Variable cost
Fixed factory overhead (note 3)
Fixed selling overhead (note 4)
Administrative overhead
Fixed cost
Total cost
Add : Profit 20% on sales or 25% on total cost
Sales
Contribution (Sales – Variable cost)
Working Notes :
85,000
Amount (`)
18,36,000
8,92,500
1,78,500
3,67,200
32,74,200
2,20,000
1,15,000
1,76,000
5,11,000
37,85,200
9,46,300
47,31,500
14,57,300
Per Unit (`)
21.60
10.50
2.10
4.32
38.52
(1) Direct Materials :
65% Capacity
75% Capacity
` 15,00,000
` 13,00,000
65% Capacity
55%
Capacity
` 13,00,000
` 11,00,000
10% change in capacity
2,00,000
10% change in capacity
2,00,000
For 10% increase in capacity, i.e., for increase by 10,000 units, the total direct material cost regularly changes by `
2,00,000
Direct material cost (variable) = ` 2,00,000 ÷ 10,000 = ` 20
After 8% increase in price, direct material cost per unit = ` 20 × 1.08 = ` 21.60
Direct material cost for 85,000 budgeted units = 85,000 × ` 21.60 = ` 18,36,000
(2) Direct Labour :
75% Capacity
`
7,50,000
65% Capacity
`
6,50,000
IPCC_34e_Costing_Budgetary Control_Assignment Solutions_____________107
Ph:
98851 25025/26
www.mastermindsindia.com
65% Capacity
55% Capacity
` 6,50,000
10% change in capacity
1,00,000
10% change in capacity
For 10% increase in capacity, direct labour cost regularly changes by ` 1,00,000.
Direct labour cost per unit = ` 1,00,000 ÷ 10,000 = ` 10
After 5% increase in price, direct labour cost per unit = ` 10 × 1.05 = ` 10.50
Direct labour for 85,000 units = 85,000 units × ` 10.50 = ` 8,92,500.
(3) Factory overheads are semi-variable overheads:
75% Capacity
65% Capacity
` 3,50,000
65% Capacity
55% Capacity
` 3,30,000
10% change in capacity
20,000
10% change in capacity
Variable factory overhead = ` 20,000 ÷ 10,000 = ` 2
Variable factory overhead for 75,000 units = 75,000 × ` 2 = ` 1,50,000
Fixed factory overhead = ` 3,50,000 – ` 1,50,000 = ` 2,00,000.
Variable factory overhead after 5% increase = ` 2 × 1.05 = ` 2.10
Fixed factory overhead after 10% increase = ` 2,00,000 × 1.10 = ` 2,20,000
(4) Selling overhead is semi-variable overhead :
75% Capacity
65% Capacity
` 4,00,000
65% Capacity
55% Capacity
` 3,60,000
10% change in capacity
40,000
10% change in capacity
Variable selling overhead = ` 40,000 ÷ 10,000 units = ` 4
Variable selling overhead for 75,000 units = 75,000 × ` 4 = ` 3,00,000.
Fixed selling overhead = ` 4,00,000 – ` 3,00,000 = ` 1,00,000
Variable selling overhead after 8% increase = ` 4 × 1.08 = ` 4.32
Fixed selling overhead after 15% increase = ` 1,00,000 × 1.15 = ` 1,15,000
` 5,50,000
1,00,000
3,30,000
` 3,10,000
20,000
`
3,60,000
3,20,000
40,000
`
`
(5) Administrative overhead is fixed :
After 10% increase = ` 1,60,000 × 1.10 = ` 1,76,000
Problem.10
Master Budget for the year ending
Sales :
Toughened Glass
Bent Glass
Total Sales
Less : Cost of
production :
Direct materials (60% of
` 8,00,000)
Direct wages (20
workers × ` 150 × 12
months)
Prime Cost
Fixed Factory
Overhead :
Works manager’s
salary (500 × 12)
Foreman’s salary (400
× 12)
(`)
6,00,000
2,00,000
8,00,000
4,80,000
36,000
5,16,000
6,000
4,800
IPCC_34e_Costing_Budgetary Control_Assignment Solutions ____________108
MASTER MINDS
No.1 for CA/CWA & MEC/CEC
Depreciation
Light and power
(assumed fixed)
Variable Factory
Overhead :
Stores and spares
Repairs and
maintenance
Sundry expenses
Works Cost
12,600
3,000
26,400
20,000
8,000
3,600
31,600
5,74,000
2,26,000
36,000
1,90,000
Gross Profit (Sales – Works cost)
Less: Adm., selling and distribution expenses
Net Profit
Problem 11
Budget Showing Current Position and Position for 2013
Position for 2012
Sales (units)
(A) Sales (` )
Direct Material
Direct wages
Factory
overhead
(variable)
Other variable
Costs
(B) Marginal
Cost
(C)
Contribution
(A-B)
Fixed costs –
Factory
– Others
(D) Total fixed
Cost
Profit
(C – D)
A
B
2,00,000
1,00,000
(`)
(`)
4,00,000
1,00,000
50,000
50,000
3,50,000
75,000
50,000
50,000
50,000
30,000
2,50,000
2,05,000
1,50,000
1,45,000
Position for 2013
Total
(A+B)
–
A
B
C
1,50,000
50,000
2,00,000
(`)
(`)
(`)
3,00,000
75,000
37,500
37,500
1,75,000
37,500
25,000
25,000
3,50,000
80,000
50,000
50,000
8,25,000
1,92,500
1,12,500
1,12,500
37,500
15,000
50,000
1,02,500
4,55,000
1,87,500
1,02,500
2,30,000
5,20,000
2,95,000
1,12,500
72,500
1,20,000
3,05,000
(`)
7,50,000
1,75,000
1,00,000
1,00,000
80,000
Total
(A+B+C)
–
(`)
1,00,000
1,00,000
80,000
1,80,000
80,000
1,80,000
1,15,000
1,25,000
Comments: Introduction of Product C is likely to increase profit by ` 10,000 (i.e. from ` 1,15,000 to ` 1,25,000)
in 2013 as compared to 2012. Therefore, introduction of product C is recommended.
THE END
IPCC_34e_Costing_Budgetary Control_Assignment Solutions_____________109

