Page 1 of 3
Gleim / Flesher CMA Review
15th Edition, 1st Printing
Part 2 Updates
Available December 2010
NOTE: Text that should be deleted from the outline is displayed as struck through with a red
background. New text is shown in courier font with a green background.
Study Unit 2 -- Financial Performance Metrics - Financial Ratios
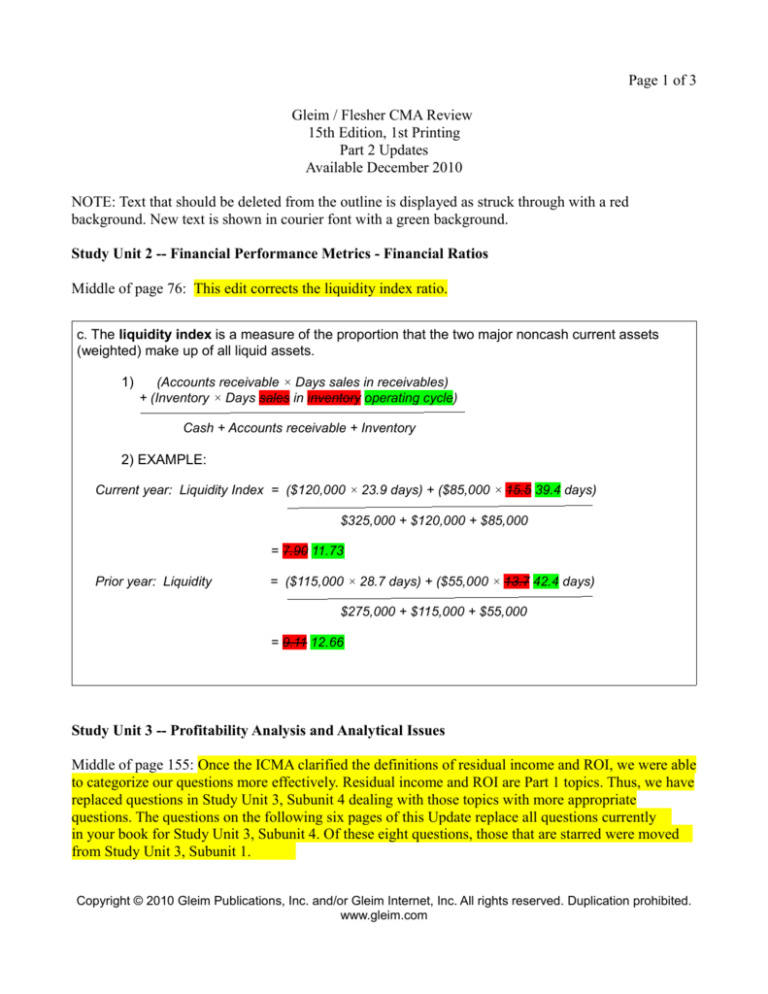
Middle of page 76: This edit corrects the liquidity index ratio.
c. The liquidity index is a measure of the proportion that the two major noncash current assets
(weighted) make up of all liquid assets.
1)
(Accounts receivable × Days sales in receivables)
+ (Inventory × Days sales in inventory operating cycle)
Cash + Accounts receivable + Inventory
2) EXAMPLE:
Current year: Liquidity Index = ($120,000 × 23.9 days) + ($85,000 × 15.5 39.4 days)
$325,000 + $120,000 + $85,000
= 7.90 11.73
Prior year: Liquidity
= ($115,000 × 28.7 days) + ($55,000 × 13.7 42.4 days)
$275,000 + $115,000 + $55,000
= 9.11 12.66
Study Unit 3 -- Profitability Analysis and Analytical Issues
Middle of page 155: Once the ICMA clarified the definitions of residual income and ROI, we were able
to categorize our questions more effectively. Residual income and ROI are Part 1 topics. Thus, we have
replaced questions in Study Unit 3, Subunit 4 dealing with those topics with more appropriate
questions. The questions on WKHIROORZLQJVL[pageVRIthis Update replace all questions FXUUHQWO\
in your book for Study Unit 3, Subunit 4. Of these eight questions, those that are starred were PRYHG
from Study Unit 3, Subunit 1.
Copyright © 2010 Gleim Publications, Inc. and/or Gleim Internet, Inc. All rights reserved. Duplication prohibited.
www.gleim.com
153
SU 3: Profitability Analysis and Analytical Issues
3.4 Profitability Analysis
39. The following information pertains to Andrew Co.
for the year ended December 31:
Sales
Net income
Average total assets
Answer (C) is correct. (Publisher, adapted)
REQUIRED: The formula used to compute ROI.
DISCUSSION: The DuPont model depicts return on assets
as total asset turnover (sales divided by average total assets)
times the profit margin (net income divided by sales). Therefore,
Andrew’s ROA calculation uses the formula [($720,000 ÷
$480,000) × ($120,000 ÷ $720,000)].
$720,000
120,000
480,000
Which one of the following formulas depicts the use of
the DuPont model to calculate Andrew’s return on
assets?
A. (720,000 ÷ 480,000) × (720,000 ÷ 120,000)
B. (480,000 ÷ 720,000) × (720,000 ÷ 120,000)
C. (720,000 ÷ 480,000) × (120,000 ÷ 720,000)
D. (480,000 ÷ 720,000) × (120,000 ÷ 720,000)
Questions 40 and 41 are based on the following information. The information that follows pertains to Devlin Company.
Statement of Financial Position as of May 31
(in thousands)
Income Statement for the year ended May 31
(in thousands)
Year 2 Year 1
Assets
Current assets
Cash
Trading securities
Accounts receivable (net)
Inventory
Prepaid expenses
Total current assets
Investments, at equity
Property, plant, and equipment (net)
Intangible assets (net)
Total assets
$ 45
30
68
90
22
$255
38
375
80
$748
$ 38
20
48
80
30
$216
30
400
45
$691
Liabilities
Current liabilities
Notes payable
Accounts payable
Accrued expenses
Income taxes payable
Total current liabilities
Long-term debt
Deferred taxes
Total liabilities
$ 35
70
5
15
$125
35
3
$163
$ 18
42
4
16
$ 80
35
2
$117
$150
225
$150
195
114
96
$585
$748
100
129
$574
$691
Equity
Preferred stock, 6%, $100 par value,
cumulative
Common stock, $10 par value
Additional paid-in capital -- common
stock
Retained earnings
Total equity
Total liabilities and equity
Net sales
Costs and expenses
Costs of goods sold
Selling, general, and administrative
Interest expense
Income before taxes
Income taxes
Net income
Year 2 Year 1
$480
$460
330
52
8
$ 90
36
$ 54
315
51
9
$ 85
34
$ 51
154
*
SU 3: Profitability Analysis and Analytical Issues
40. Assuming there are no preferred stock dividends
in arrears, Devlin Company’s return on common
equity for the year ended May 31, Year 2, was
A. 6.3%
B. 7.5%
C. 7.8%
D. 10.5%
*
41. Devlin Company’s rate of return on assets for the
year ended May 31, Year 2, was
A. 7.2%
B. 7.5%
C. 7.8%
D. 11.2%
Answer (D) is correct. (CMA, adapted)
REQUIRED: The return on common equity.
DISCUSSION: The return on common equity equals income
available to common shareholders divided by average common
equity. Income available to common shareholders is $45 [$54
net income – ($150 par value of preferred stock × 6%)]. Average
common equity is $429.5 {[$574 beginning total equity – $150
beginning preferred stock) + ($585 ending total equity – $150
ending preferred stock)] ÷ 2}. Thus, the return is 10.5% ($45 ÷
$429.5).
Answer (A) is incorrect. Average total assets are based on
6.3%. Answer (B) is incorrect. Net income divided by average
total assets equals 7.5%. Answer (C) is incorrect. Net income
divided by beginning total assets equals 7.8%.
Answer (B) is correct. (CMA, adapted)
REQUIRED: The rate of return on assets.
DISCUSSION: The rate of return on assets equals net
income divided by average total assets. Accordingly, the rate of
return is 7.5% {$54 ÷ [($748 + $691) ÷ 2]}.
Answer (A) is incorrect. The figure of 7.2% uses ending total
assets instead of average total assets. Answer (C) is incorrect.
Net income divided by beginning total assets equals 7.8%.
Answer (D) is incorrect. The return on sales is 11.2%.
Question 42 is based on the following information. The Statement of Financial Position for King Products Corporation for
the fiscal years ended June 30, Year 2, and June 30, Year 1, is presented below. Net sales and cost of goods sold for the
year ended June 30, Year 2, were $600,000 and $440,000, respectively.
King Products Corporation
Statement of Financial Position
(in thousands)
Cash
Marketable securities (at market)
Accounts receivable (net)
Inventories (at lower of cost or market)
Prepaid items
Total current assets
June 30
Year 2
Year 1
$ 60
$ 50
40
30
90
60
120
100
30
40
$ 340
$280
Land (at cost)
Building (net)
Equipment (net)
Patents (net)
Goodwill (net)
Total long-term assets
Total assets
200
160
190
70
40
$ 660
$1,000
190
180
200
34
26
$630
$910
Notes payable
Accounts payable
Accrued interest
Total current liabilities
$
46
94
30
$ 170
$ 24
56
30
$110
Notes payable, 10% due 12/31/Year 7
Bonds payable, 12% due 6/30/Year 10
Total long-term debt
Total liabilities
Preferred stock -- 5% cumulative, $100 par,
nonparticipating, authorized, issued and outstanding,
2,000 shares
Common stock -- $10 par, 40,000 shares authorized,
30,000 shares issued and outstanding
Additional paid-in capital -- common
Retained earnings
Total equity
Total liabilities & equity
20
30
$ 50
$ 220
20
30
$ 50
$160
200
200
300
150
130
$ 780
$1,000
300
150
100
$750
$910
155
SU 3: Profitability Analysis and Analytical Issues
*
42. Assuming that King Products Corporation’s net
income for the year ended June 30, Year 2, was
$70,000 and there are no preferred stock dividends in
arrears, King Products Corporation’s return on
common equity was
A. 7.8%
B. 10.6%
C. 10.9%
D. 12.4%
*
43. If Company A has a higher rate of return on
assets than Company B, the reason may be that
Company A has a <List A> profit margin on sales, a
<List B> asset-turnover ratio, or both.
List A
List B
A.
Higher
Higher
B.
Higher
Lower
C.
Lower
Higher
D.
Lower
Lower
Answer (B) is correct. (CMA, adapted)
REQUIRED: The return on common equity for Year 2.
DISCUSSION: The return on common equity equals income
available to common shareholders divided by the average
common equity. The preferred stock dividend requirement is
$10,000 ($200,000 par value × 5%), so the income available to
common shareholders is $60,000 ($70,000 NI – $10,000). Given
that preferred equity was $200,000 at all relevant times,
beginning and ending common equity was $550,000 ($750,000
total – $200,000) and $580,000 ($780,000 total – $200,000), an
average of $565,000 [($580,000 + $550,000) ÷ 2]. The return on
common equity was therefore 10.6% ($60,000 ÷ $565,000).
Answer (A) is incorrect. The percentage 7.8% includes
preferred equity in the denominator. Answer (C) is incorrect.
Using beginning-of-the-year equity results in 10.9%. Answer (D)
is incorrect. Not subtracting the preferred dividend requirement
from net income results in 12.4%.
Answer (A) is correct. (CIA, adapted)
REQUIRED: The reason for a higher rate of return on
assets.
DISCUSSION: The DuPont model treats the return on
assets as the product of the profit margin and the asset turnover:
96 8
8
If one company has a higher return on assets than another, it
may have a higher profit margin, a higher asset turnover, or
both.
156
SU 3: Profitability Analysis and Analytical Issues
Question 44 is based on the following information.
Lisa, Inc.
Statement of Financial Position
December 31, Year 2 (in thousands)
Assets
Current assets
Cash
Trading securities
Accounts receivable (net)
Inventories (at lower of cost or market)
Prepaid items
Total current assets
Long-term investments
Securities (at cost)
Property, plant, & equipment
Land (at cost)
Building (net)
Equipment (net)
Intangible assets
Patents (net)
Goodwill (net)
Total long-term assets
Total assets
Liabilities & shareholders’ equity
Current liabilities
Notes payable
Accounts payable
Accrued interest
Total current liabilities
Long-term debt
Notes payable 10% due 12/31/Year 9
Bonds payable 12% due 12/31/Year 8
Total long-term debt
Total liabilities
Shareholders’ equity
Preferred - 5% cumulative, $100 par,
non-participating, 1,000 shares authorized,
issued and outstanding
Common - $10 par 20,000 shares authorized,
15,000 issued and outstanding shares
Additional paid-in capital - common
Retained earnings
Total shareholders’ equity
Total liabilities & equity
44. Assuming that Lisa, Inc.’s net income for Year 2
was $35,000, and there were no preferred stock
dividends in arrears, Lisa’s return on common equity
for Year 2 was
A. 7.8%
B. 10.6%
C. 10.9%
D. 12.4%
Year 2
Year 1
$ 30
20
45
60
15
170
$ 25
15
30
50
20
140
25
20
75
80
95
75
90
100
35
20
330
$500
17
13
315
$455
$23
47
15
85
$12
28
15
55
10
15
25
$110
10
15
25
$ 80
$100
$100
150
75
65
$390
$500
150
75
50
$375
$455
Answer (B) is correct. (CMA, adapted)
REQUIRED: The return on common equity assuming no
preferred stock dividends are in arrears.
DISCUSSION: The return on common equity equals income
available to common shareholders divided by average common
equity. The preferred stock dividend requirement is 5%, or
$5,000 (5% × $100,000). Deducting the $5,000 of preferred
dividends from the $35,000 of net income leaves $30,000 for the
common shareholders. The firm began the year with common
equity of $275,000 and ended with $290,000. Thus, the average
common equity during the year was $282,500. The return on
common equity was 10.6% ($30,000 ÷ $282,500).
Answer (A) is incorrect. Including the $100,000 of preferred
stock in the denominator results in 7.8%. Answer (C) is
incorrect. The beginning shareholders’ equity of $275,000 is
based on 10.9%. Answer (D) is incorrect. Total net income of
$35,000 is based on 12.4%.
SU 3: Profitability Analysis and Analytical Issues
157
Question 45 is based on the following information.
A company reports the following account balances
at year-end:
Account
Long-term debt
Cash
Net sales
Fixed assets (net)
Tax expense
Inventory
Common stock
Interest expense
Administrative expense
Retained earnings
Accounts payable
Accounts receivable
Cost of goods sold
Depreciation expense
Balance
$200,000
50,000
600,000
320,000
67,500
25,000
100,000
20,000
35,000
150,000
65,000
120,000
400,000
10,000
Additional Information:
• The opening balance of common stock was
$100,000.
• The opening balance of retained earnings
was $82,500.
• The company had 10,000 common shares
outstanding all year.
• No dividends were paid during the year.
45. For the year just ended, the company had a rate
of return on common equity, rounded to two decimals,
of
A. 31.21%
B. 58.06%
C. 67.50%
D. 71.68%
Answer (A) is correct. (CIA, adapted)
REQUIRED: The rate of return on common equity for the
year just ended.
DISCUSSION: The return on common equity equals income
available to common shareholders divided by average common
equity. Since the company has no preferred stock, income
available to common shareholders is the same as net income
($600,000 sales – $400,000 cost of goods sold – $35,000
administrative expenses – $10,000 depreciation – $20,000
interest expense – $67,500 taxes = $67,500). The opening
balance of common equity was $182,500 ($100,000 common
stock + $82,500 retained earnings) and the closing balance was
$250,000 ($182,500 opening balance + $67,500 net income).
Average common equity for the year was thus $216,250
[($182,500 + $250,000) ÷ 2]. Return on common equity was
31.21% ($67,500 ÷ $216,250).
Answer (B) is incorrect. This percentage excludes common
stock from the denominator. Answer (C) is incorrect. This
percentage excludes retained earnings from the denominator.
Answer (D) is incorrect. This percentage excludes interest
expense and tax expense from the numerator.
158
*
SU 3: Profitability Analysis and Analytical Issues
46. The Intelinet Corporation and Comp, Inc. have
assets of $100,000 each and a return on common
equity of 17%. Intelinet has twice the debt of Comp
while Comp has half the sales of Intelinet. If Intelinet
has net income of $10,000 and a total assets turnover
ratio of 3.5, what is Comp Inc.’s profit margin?
A. 3.31%
B. 7.71%
C. 10.00%
D. 13.50%
Answer (B) is correct. (Publisher, adapted)
REQUIRED: The profit margin percentage for Comp.
DISCUSSION: Since Intelinet’s ROCE, net income, assets,
and debt (in terms of Comp’s debt) are known, they can be
plugged into the formula for return on common equity to
determine Comp’s debt level:
ROCE = (Net income – Preferred dividends) ÷
Average common equity
.17 = ($10,000 – $0) ÷ ($100,000 – 2D)
.17 × ($100,000 – 2D) = $10,000
$17,000 – .34D = $10,000
.34D = $7,000
D = $20,588
Now that Comp’s debt is known, it can be substituted in the
ROCE formula to find net income:
ROCE = (Net income – Preferred dividends) ÷
Average common equity
.17 = (NI – $0) ÷ ($100,000 – $20,588)
= NI ÷ $79,412
NI = $13,500
Since Comp’s sales are one-half those of Intelinet, they amount
to $175,000 ($350,000 ÷ 2). Therefore, Comp’s profit margin
percentage is $13,500 ÷ $175,000, or 7.71%.
Answer (A) is incorrect. This percentage is based on the
wrong income. Answer (C) is incorrect. This percentage is the
return on assets for Intelinet Corp. Answer (D) is incorrect. This
percentage is the return on assets for Comp.
Page 2 of 3
Study Unit 5 -- Financial Instruments and Cost of Capital
Middle of page 215: This corrects an amount in the example.
Component cost of preferred equity = Cash dividend ÷ Market price of stock
= ($40,000,000 × 11.5%) ÷ $4,600,000
= 10.0%
Top of page 239: This corrects the cost of capital curve description.
52. In referring to the graph of a firm’s cost of capital,
if e is the current optimal position, which one of the following
statements best explains the saucer or U-shaped
curve?
A. The composition of debt and equity does not
affect the firm’s cost of capital.
B. The cost of capital is almost always favorably
influenced by increases in financial leverage.
C. The cost of capital is almost always negatively
influenced by increases in financial leverage.
D. Use of at least some debt financing will
enhance the value of the firm.
53. In referring to the graph of a firm’s cost of capital,
if e is the current optimal position, which one of the following
statements best explains the saucer or U-shaped
curve?
A. The cost of capital is almost always favorably
influenced by increases in financial leverage.
B. The cost of capital is almost always negatively
influenced by increases in financial leverage.
C. The financial markets will penalize firms that
borrow even in moderate amounts.
D. Use of at least some debt financing will
enhance the value of the firm.
Answer (D) is correct. (CMA, adapted)
REQUIRED: The best explanation of the U-shaped curve
in a cost-of-capital graph.
DISCUSSION: The U-shaped curve indicates that the cost
of capital is quite high when the debt-to-equity ratio is quite
low. As debt increases, the cost of capital declines as long as
the cost of debt is less than that of equity. Eventually, the
decline in the cost of capital levels off because the cost of debt
ultimately rises as more debt is used. Additional increases in
debt (relative to equity) will then increase the cost of capital.
The implication is that some debt is present in the optimal
capital structure because the cost of capital initially declines
when debt is added. However, a point is reached (e) at which
debt becomes excessive and the cost of capital begins to rise.
Answer (A) is incorrect. The composition of the capital
structure affects the cost of capital since the components have
different costs. Answer (B) is incorrect. The cost of debt does
not remain constant as financial leverage increases.
Eventually, that cost also increases. Answer (C) is incorrect.
Increased leverage is initially favorable.
Answer (D) is correct. (CMA, adapted)
REQUIRED: The best explanation of the U-shaped curve
in a cost-of-capital graph.
DISCUSSION: The U-shaped curve indicates that the cost
of capital is quite high when the debt-to-equity ratio is quite
low. As debt increases, the cost of capital declines as long as
the cost of debt is less than that of equity. Eventually, the
decline in the cost of capital levels off because the cost of debt
ultimately rises as more debt is used. Additional increases in
debt (relative to equity) will then increase the cost of capital.
The implication is that some debt is present in the optimal
capital structure because the cost of capital initially declines
when debt is added. However, a point is reached (e) at which
debt becomes excessive and the cost of capital begins to rise.
Answer (A) is incorrect. The cost of debt does not remain
constant as financial leverage increases. Eventually, that cost
also increases. Answer (B) is incorrect. Increased leverage is
initially favorable. Answer (C) is incorrect. The initial decline in
the U-shaped graph indicates that the financial markets
reward moderate levels of debt.
Copyright © 2010 Gleim Publications, Inc. and/or Gleim Internet, Inc. All rights reserved. Duplication prohibited.
www.gleim.com
Page 3 of 3
Study Unit 6 -- Managing Current Assets
Middle of page 255: This corrects amounts in the example.
October purchases:
September purchase:
August purchases:
October payroll:
October op. expenses
Interest
Total October disbursements
$350,000 × 50% = $150,000175,000
$300,000 × 25% = 102,00075,000
$250,000 × 25% = 33,00062,500
$370,000 × 10% = 37,000
$280,000 × 20% = 56,000
5,000
$410,500
Bottom of page 302: This corrects the calculations in the answer explanation to match the question
stem.
94. A firm that often factors its accounts receivable
has an agreement with its finance company that
requires the firm to maintain a 6% reserve and
charges a 1.4% commission on the amount of the
receivables. The net proceeds would be further
reduced by an annual interest charge of 15% on the
monies advanced. Assuming a 360-day year, what
amount of cash (rounded to the nearest dollar) will the
firm receive from the finance company at the time a
$100,000 account that is due in 60 days is turned
over to the finance company?
Answer (C) is correct. (Publisher, adapted)
REQUIRED: The proceeds of factoring.
DISCUSSION: The first step is to calculate the gross
proceeds the firm will receive from the factoring transaction:
Amount of receivable
Less: reserve ($100,000 × 6%)
Less: factor fee ($100,000 × 1.4%)
Gross proceeds
$100,000
(6,000)
(1,400)
$ 92,600
This amount must be reduced by the interest charged on the
gross proceeds:
A. $92,600
B. $96,135
C. $90,285
Gross proceeds
Times: annual finance charge
Annualized interest expense
Times: portion of year (9060 days ÷ 360 days)
Interest expense
$92,600
× 15%
$13,890
× 16.7%
$ 2,315
D. $85,000
The actual cash the firm will receive from this factoring
transaction is thus calculated as follows:
Gross proceeds
Less: interest expense
Net proceeds
$92,600
(2,315)
$90,285
Answer (A) is incorrect. The amount of $92,600 results from
failing to consider the interest expense. Answer (B) is
incorrect. The amount of $96,135 results from failing to
subtract the 6% reserve. Answer (D) is incorrect. The amount
of $85,000 assumes that the only amount withheld is a full
year’s interest on $100,000.
Copyright © 2010 Gleim Publications, Inc. and/or Gleim Internet, Inc. All rights reserved. Duplication prohibited.
www.gleim.com


