Surface Roughness – Significance and symbol
advertisement
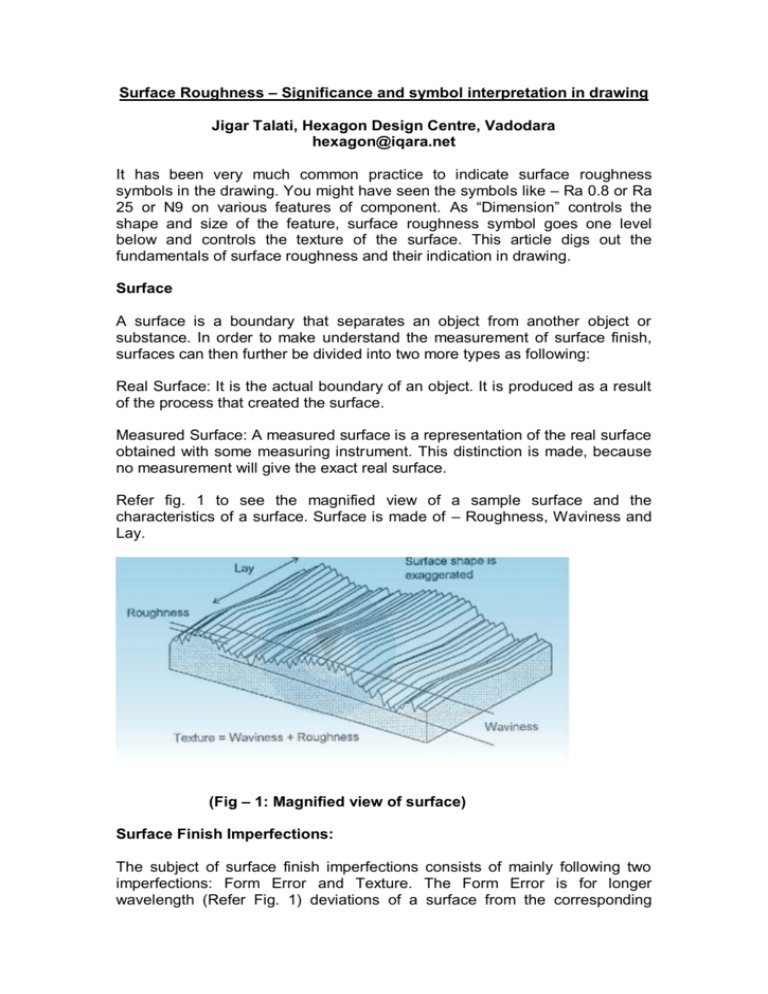
Surface Roughness – Significance and symbol interpretation in drawing Jigar Talati, Hexagon Design Centre, Vadodara hexagon@iqara.net It has been very much common practice to indicate surface roughness symbols in the drawing. You might have seen the symbols like – Ra 0.8 or Ra 25 or N9 on various features of component. As “Dimension” controls the shape and size of the feature, surface roughness symbol goes one level below and controls the texture of the surface. This article digs out the fundamentals of surface roughness and their indication in drawing. Surface A surface is a boundary that separates an object from another object or substance. In order to make understand the measurement of surface finish, surfaces can then further be divided into two more types as following: Real Surface: It is the actual boundary of an object. It is produced as a result of the process that created the surface. Measured Surface: A measured surface is a representation of the real surface obtained with some measuring instrument. This distinction is made, because no measurement will give the exact real surface. Refer fig. 1 to see the magnified view of a sample surface and the characteristics of a surface. Surface is made of – Roughness, Waviness and Lay. (Fig – 1: Magnified view of surface) Surface Finish Imperfections: The subject of surface finish imperfections consists of mainly following two imperfections: Form Error and Texture. The Form Error is for longer wavelength (Refer Fig. 1) deviations of a surface from the corresponding nominal surface. Form errors result from large scale problems in the manufacturing process such as errors in a machine tool ways, guides or spindles, inaccurate alignment of work-piece. Form error is on the dividing line in size scale between geometric errors and finish errors. We shall be discussing more on the surface Texture imperfection, as it is indicated in the drawing as surface roughness symbol. Surface Texture Surface texture is the combination of fairly short wavelength deviations of a surface from the nominal surface. Texture includes roughness, waviness and a lay, that is, all of the deviations that are shorter in wavelength than form error deviations. Roughness Roughness includes the finest (shortest wavelength) irregularities of a surface. Roughness generally results from a particular production process or material condition. Waviness Waviness includes the more widely spaced (longer wavelength) deviations of a surface from its nominal shape. Waviness errors are intermediate in wavelength between roughness and form error. Note, that distraction between waviness and form error is not always made in practice and it is not always clear how to make it. Lay Lay refers to the predominant direction of the surface texture. Ordinarily, lay is determined by the particular production method and geometry used. However, in practice, both the words - „Surface Texture‟ and „Surface Roughness‟ are used to explain common meaning of surface roughness symbols. Surface roughness heights are generally measured in micro inches or micrometers. A micrometer, abbreviated µ, is one millionth of a meter. As points of reference for how small a micrometer is, here are the sizes of some familiar items: LENGTH OF FOOTBALL FIELD – 9,00,00,000 µm WIDTH OF HAND – 75,000 – 1,00,000 µm THICKNESS OF PANE OF GLASS – 2,000 – 3,000 µm DIAMETER OF HUMAN HAIR – 40 – 75 µm THICKNESS OF PAPER – 25 – 50 µm DIAMETER OF A SPIDER WEB STRAND – 2.5 TO 5 µm WAVELENGTH OF VISIBLE LIGHT – 0.4 TO 0.75 µm “DIAMETER” OF A HYDROGEN ATOM – 0.0001 µm A micrometer is very small!! Interpretation of surface traces To be of any use to humans, surface traces are magnified moderately in the horizontal direction and significantly in the vertical direction in order to be presented on a computer screen or a piece of paper. As a typical example, a 4 mm trace with a 10 µ height from the highest peak to lowest valley might be expanded to fit on a 160 mm wide by 100 mm high plot. This is a 40X magnification horizontally and a 10,000X magnification vertically. This differences leads to a very sharply undulating trace that easily deceives the uninitiated as to the actual shape of the surface. (Figure 2: Interpretation of surface trace) The vertical magnification of a surface trace is ordinarily much greater than the horizontal magnification. A trace that looks jagged and rough to the eye is really a distorted view of a nearly flat surface with moderate ripples across it. Figure 3 presents the actual surface texture plot taken by a surface roughness measuring instrument in a laboratory. (Figure 3: Roughness amplitude parameter for Interpretation of surface roughness plot) There can be many ways, thro which the surface roughness plot can be interpreted. Few of the most popular methods of surface roughness plot interpretation are: Distance between peak to centerline Average distance between peaks and valleys for sample length Sum of average of first 5 peaks and valleys Maximum peak to valley height Maximum peak height RMS of peak and valley average Because of this reason only, there are varieties of methods prevailing in the engineering world for indicating surface roughness values in the drawing. As per the data, worldwide more than 128 conventions are available for interpreting above graph and presenting the results in the drawing! The most common and popular method amongst all is interpreting thro average roughness indication. This is known as Ra – in which, R stands for „Roughness‟ and „a‟ stands for „average‟. The other methods are Rz, Rt, Rmax etc. Below is the list of popular parameters: Parameter Name Ra Roughness Average (Ra) Rq Root Mean Square (RMS) Roughness Rt Maximum Height of the Profile Rv, Rm Maximum Profile Valley Depth Rp Maximum Profile Peak Height Rpm Average Maximum Profile Peak Height Rz Average Maximum Height of the Profile Rmax Maximum Roughness Depth Rc Mean Height of Profile Irregularities Rz(iso) Roughness Height Ry Maximum Height of the Profile It is a common joke in surface finish circles that “RA” stands for Regular Army and “Ra” is the chemical symbol for Radium; only “Ra” is the average roughness of a surface. This emphasizes that the “a” is a subscript. Ra – Average Roughness Also known as Arithmetic Average (AA), Center Line Average (CLA), Arithmetical Mean Deviation of the profile. The average roughness is the area between the roughness profile and its mean line, or the integral of the absolute value of the roughness profile height over the evaluation length. Graphically, the average roughness is the area between the roughness profile and its center line divided by the evaluation length (normally five sample lengths with each sample length equal to one cutoff). The average roughness is by far the most commonly used parameter in surface finish measurement. The earliest analog roughness measuring instruments measured only Ra by drawing a stylus continuously back and forth over a surface and integrating (finding the average) electronically. It is fairly easy to take the absolute value of a signal and to integrate a signal using only analog electronics. That is the main reason Ra has such a long history. Surface Roughness symbol in drawing Surface roughness symbol is given to convey manufacturing process related information only. Unless written specifically on the symbol, they do not carry the surface texture type (i.e. plated / milled / cold drawn). These symbols are given irrespective of material and its surface condition. Though the surface roughness symbol is capable of conveying lot much information (as mentioned later in this article), presently it is mentioned to convey only manufacturing process related information. Also, note that the raw material type is not controlled thro the surface roughness symbol given in the drawing. Presently, either of following information is conveyed thro symbols: We do not need to remove material We need machining operation We need to manufacture by any process It is required to give surface finish to each feature – irrespective of its importance and manufacturing process. And, as in tolerance, designer should select the most „Rough‟ surface permissible for the performance. However, unlike to tolerances where we have a concept of „Open Tolerance‟, we have to specify each surface roughness in the drawing. Indian context and practices of using Ra The latest Indian Standard for method of indicating surface texture on technical drawings suggests the practice of giving the surface roughness value directly in micron as Ra value or by grade numbers. The earlier method of indicating surface roughness through triangle symbols is now superseded, however still many companies are following the older practice. Below is the comparison table for all 3 ways of indicating surface roughness symbol in the drawing. Roughness value Ra (µm) 50 25 12.5 6.3 3.2 1.6 0.8 0.4 0.2 0.1 0.05 0.025 Roughness grade number Roughness symbol N12 N11 N10 N9 N8 N7 N6 N5 N4 N3 N2 N1 Following three basic symbols are used for indicating surface texture on components: Surface texture obtained by any manufacturing process (e.g., turning, grinding, plating, bending) Surface texture obtained by material removal by machining Operation (e.g., turning, drilling, Milling, slotting) Surface texture obtained by WITHOUT removal of material (e.g., casting surfaces, welding faces, Procurement size surface) Excepting the symbol of „Without removal of material‟, both the other symbols are defined with value of Ra required for a particular manufacturing process. Meaning of complete surface finish symbol is as below: a = Roughness value Ra in micrometer or grade number b = Production method, treatment or coating c = Sampling length d = Direction of lay e = Machining allowance f = Other roughness value than Ra Ra is not the end of the story Ra does not tell the whole story about a surface. For example, here three surfaces that all have the same Ra, but you need no more than your eyes to know that they are quite different surfaces. In some applications they will perform very; differently as well. (Figure 4: Surfaces with same Ra, but a lot of difference) If we want to distinguish between surfaces that differ in shape or spacing, we need to calculate other parameters for a surface that measure peaks and valleys and profile shape and spacing. The more complicated the shape of the surface, we want and the more critical the function of the surface, the more sophisticated we need to be in measuring parameters beyond Ra.

