Problems 5th Ed 2013 Managed Funds
advertisement
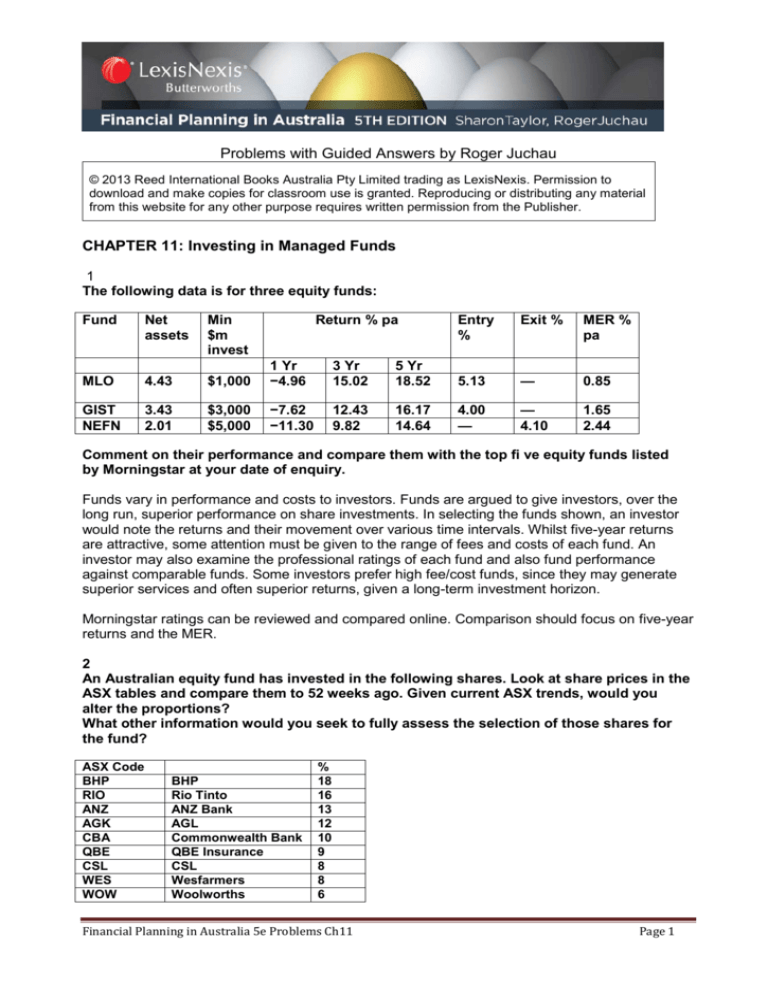
Problems with Guided Answers by Roger Juchau © 2013 Reed International Books Australia Pty Limited trading as LexisNexis. Permission to download and make copies for classroom use is granted. Reproducing or distributing any material from this website for any other purpose requires written permission from the Publisher. CHAPTER 11: Investing in Managed Funds 1 The following data is for three equity funds: Fund Net assets Min $m invest Return % pa MLO 4.43 $1,000 1 Yr −4.96 3 Yr 15.02 GIST NEFN 3.43 2.01 $3,000 $5,000 −7.62 −11.30 12.43 9.82 Entry % Exit % MER % pa 5 Yr 18.52 5.13 — 0.85 16.17 14.64 4.00 — — 4.10 1.65 2.44 Comment on their performance and compare them with the top fi ve equity funds listed by Morningstar at your date of enquiry. Funds vary in performance and costs to investors. Funds are argued to give investors, over the long run, superior performance on share investments. In selecting the funds shown, an investor would note the returns and their movement over various time intervals. Whilst five-year returns are attractive, some attention must be given to the range of fees and costs of each fund. An investor may also examine the professional ratings of each fund and also fund performance against comparable funds. Some investors prefer high fee/cost funds, since they may generate superior services and often superior returns, given a long-term investment horizon. Morningstar ratings can be reviewed and compared online. Comparison should focus on five-year returns and the MER. 2 An Australian equity fund has invested in the following shares. Look at share prices in the ASX tables and compare them to 52 weeks ago. Given current ASX trends, would you alter the proportions? What other information would you seek to fully assess the selection of those shares for the fund? ASX Code BHP RIO ANZ AGK CBA QBE CSL WES WOW BHP Rio Tinto ANZ Bank AGL Commonwealth Bank QBE Insurance CSL Wesfarmers Woolworths % 18 16 13 12 10 9 8 8 6 Financial Planning in Australia 5e Problems Ch11 Page 1 Each student will account differently for value change and alteration of proportions depending on the date of the problem assignment. In assessing performance, the returns and costs of the fund would be important as would its ratings, its index comparison and its position in league tables generated by advisers and the financial media. Other information would be the standing of the managers of the fund and whether large institutional investors continue to support it. Super funds investments are useful references in this regard. Online sources, Morningstar and Yahoo Finance, supply important information. A cross-check with ASX and ASIC is important to see whether there are regulatory issues with shares nominated. 3 You are considering investing in a fi xed-income security fund because it off ers stability in income. Look at two bonds funds, BT Australian Bond Fund and Russell Australian Bond Fund, and compare their returns today and 52 weeks ago. Account for any changes in returns performance over this period. Any account of changes would include movements in market interest rates, changes in demand for bond funds, changes in ratings and new competition from other bond funds and any evaluations done in the press and in online financial media. 4a A year ago, YZ Fund was trading at $77, when its NTA was $71. Today the fund is quoted at a price of $84, while its NTA stands at $89.99. If the fund paid $1.04 to shareholders over the past year, what is the holding period return (based on share price) on YZ Fund? The return can be determined on both NTA based and market price based data. NTA based Change in NTA ($79.99 – $65) Distributions Return Holding period return = 16.03 65 $ 14.99 1.04 16.03 = 24.6% Market price based Change in price ($74 – $67) Distributions Return $ 7.00 1.04 8.04 Holding period return = = 8.04 67 Financial Planning in Australia 5e Problems Ch11 12% Page 2 4b A year ago, an investor bought 400 units of a managed fund at $9.50 per unit; over the past year, the fund has made an income distribution of 70 cents per unit and had a capital gains distribution of 85 cents per unit. Find the investor’s holding period return, given that this fund now has a net tangible asset value of $11.10. Return for the year (all changes on a per unit basis): Change in price ($11.10 – $9.50) $1.60 Income distributions 0.70 Capital gains distributions 0.85 Total return $3.15 Holding period return = $3.15 $9.50 = 33.2% 5 You have uncovered the following per-unit information about a certain listed fund: 2011 2012 2013 46.20 43.20 2.10 1.83 64.68 60.47 2.84 6.26 61.78 57.75 2.61 4.32 55.00 51.42 46.20 43.20 64.68 60.47 Ending unit prices ($): Offer NTA Income distributions Capital gains distributions Beginning unit prices: Offer NTA Evaluate this fund’s performance 2011 to 2013, identifying changes requiring further investigation. Ending (offer) price Purchase (offer) price Net increase/(decrease) Return for the year: Income distributions Capital gains distributions Net increase in price Total return Holding period return (Total return/Purchase price) 2011 $46.20 55.00 ($ 8.80) 2012 $64.68 46.20 $18.48 2013 $61.78 64.68 ($2.90) $2.10 1.83 (8.80) ($4.87) –8.9% $2.84 6.26 18.48 $27.58 59.7% $2.61 4.32 (2.90) $4.03 6.2% Volatilities in returns and offer prices need scrutiny and review over a five-year period. Financial Planning in Australia 5e Problems Ch11 Page 3 3-year Compounded Rate of Return: Begin a b c Income Capital Gains Closing NTA Net Cash Flow –51.42 –51.42 2011 2.10 1.83 2012 2.84 6.26 3.93 9.10 2013 2.61 4.32 57.75 64.68 Using a financial calculator, the three-year average annual compounded rate of return is: 16.14%. 6 You have been approached by a conservative investor for guidance on investing in property and property managed funds. He is concerned about the drawbacks of investing directly in property or indirectly in property managed funds (REITs). Outline how a conservative investor may balance the risks of both investments, medium to long-term. Conservative investors usually prefer listed funds short and long term, since they can readily liquidate their investments when adverse conditions are likely. While unlisted funds may offer less volatility, they can be problematical in adverse conditions and may hold back returns to investors if their liquidity tightens. Less conservative investors may hold some unlisted funds where their assets are in a strong sector of the economy. Features of funds are detailed in the section ‘Listed and unlisted funds’ in Chapter 11. Balancing of risks is conditioned by economic conditions — in strong economic conditions, conservative investors may add well-performed unlisted funds to their portfolio of funds. 7 Listed below is the 10-year, per-unit performance record of Tom and Nicole’s Growth Fund: Income distributions Capital gains distributions Net tangible asset value: Beginning of year End of year 2013 $0.83 2012 $1.24 2011 $0.90 2010 $0.72 2009 $0.46 2008 $0.65 2007 $0.37 2006 $0.26 2005 $0.33 2004 $0.58 2.42 3.82 - 9.02 6.84 1.78 3.69 1.88 1.23 9.92 58.60 52.92 44.10 59.85 55.34 37.69 35.21 34.25 19.68 29.82 64.84 58.60 52.92 44.10 59.85 55.34 37.69 35.21 34.25 19.68 Use this information to fi nd the fund’s rate of return over the three-year period 2011–13 and the 10-year period 2004–13. Return for the three-year period: (Return = $29.95) a Income b Capital Gains c Closing NTA Net Cash Flow 2013 0. 83 2.42 64.84 68.09 2012 1.24 3.82 2011 0.90 5. 06 0.90 Financial Planning in Australia 5e Problems Ch11 2010 - 44.10 - 44.10 Page 4 Compounded return for the l0-year period: (Compounded return 21.1%) 2013 0.83 2012 1.24 b) Capital gains 2.42 3.82 c) Closing NTA 64.84 Net Cash Flow 68.09 a) Income 2011 0.90 2010 0.72 2009 0.46 2008 0.65 2007 0.37 2006 0.26 2005 0.33 9.02 6.84 1.78 3.69 1.88 1.23 2004 2003 0.58 9.92 – 29.82 5.06 0.90 9.74 7.30 2.43 4.06 2.14 1.56 10.50 – 29.82 8 Your uncle wishes to invest in the Rally Fund which has performed well over five years. He supplies you the details below. He is worried about the future risk and volatility of share returns in the fund. He tells you the fund requires a minimum investment of $1,000 and an ongoing fee of 4.1%. How would you advise your uncle about this investment and what he should monitor if he were to invest in this fund? Fund Rally Fund S&P/ASX 200 Accumulation Index 1 Yr % 39.0 23.7 3 Yr % PA 32.6 23.4 5 Yr % PA 31.2 21.3 Top 10 Stocks % Sectors the Fund is invested in % BHP Billiton (BHP) Rio Tinto (RIO) ANZ Bank (ANZ) ASX Limited (ASX) Commonwealth Bank (CBA) QBE Insurance Group (QBE) Wesfarmers (WES) CSL (CSL) AGL (AGK) Telstra 16.64 10.30 6.57 5.87 5.15 4.56 4.04 3.78 3.59 3.35 Financial services Materials Industrials Healthcare Consumer discretionary Consumer staples Cash Energy IT Telecommunications 31 28 9 9 7 5 4 3 2 2 The response of students will be conditioned by the date of the assigned case and current views about the Accumulation Index as a yardstick. In advising the uncle, reference must be made to ratings and performance of the fund as disclosed in the financial media and by the rating agencies. Of course he would need to compare the fund’s performance and costs against similarly constituted funds. In reviewing the fund, he could examine the sector weightings and monitor whether the fund has been rebalancing these weightings in light of ASX performance, economic trends, global changes and the fortunes of firms in the sector (eg, Telstra). He would need to check whether there were significant changes in the managers of the fund and any related comment in the media. The disclosed data of the fund performance in the table would give confidence to the uncle. The uncle’s risk profile and return expectations will also have to be factored into any advice given. Also, the uncle could be given historical share performance data (20-year horizons) to secure a realistic view of returns. Financial Planning in Australia 5e Problems Ch11 Page 5


