Louis Chan, CFA 陈少威
公司报告:新秀丽 (01910 HK)
+852 2509 5310
louis.chan@gtjas.com.hk
24 March 2015
Solid Fundamental Pricing in, Downgrade to “Accumulate”
稳固的基本面正在价格上反映,下调至“收集”
GTJA Research 国泰君安研究
Company Report: Samsonite (01910 HK)
Accumulate
Rating:
Downgraded
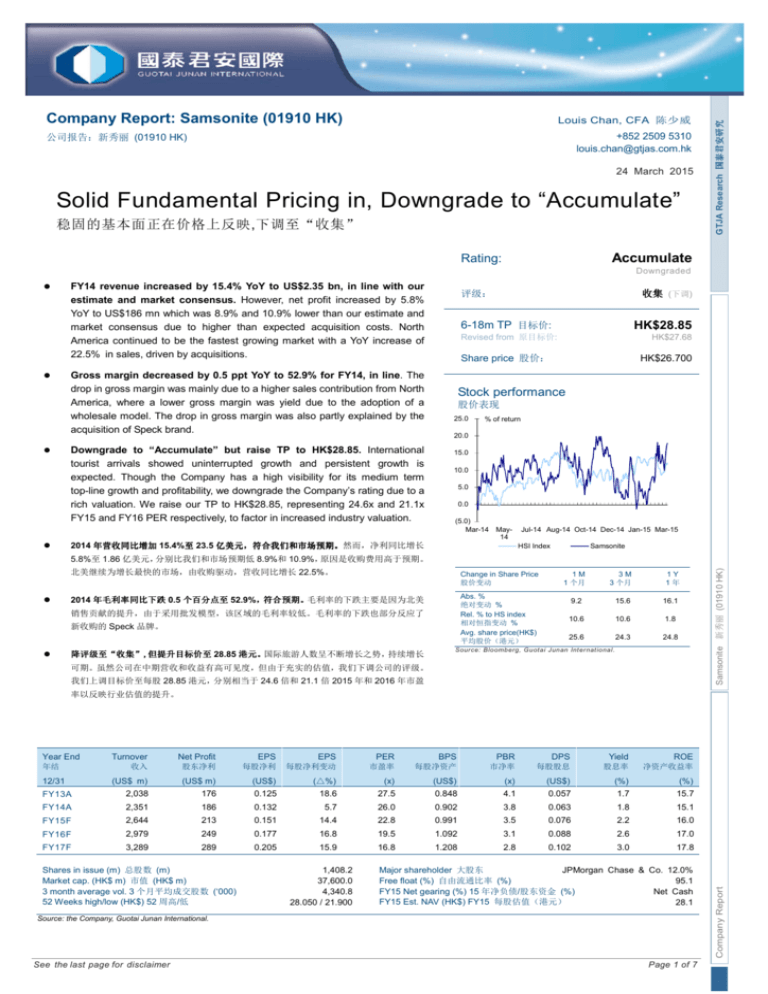
FY14 revenue increased by 15.4% YoY to US$2.35 bn, in line with our
estimate and market consensus. However, net profit increased by 5.8%
YoY to US$186 mn which was 8.9% and 10.9% lower than our estimate and
market consensus due to higher than expected acquisition costs. North
America continued to be the fastest growing market with a YoY increase of
22.5% in sales, driven by acquisitions.
Gross margin decreased by 0.5 ppt YoY to 52.9% for FY14, in line. The
drop in gross margin was mainly due to a higher sales contribution from North
America, where a lower gross margin was yield due to the adoption of a
wholesale model. The drop in gross margin was also partly explained by the
acquisition of Speck brand.
Downgrade to “Accumulate” but raise TP to HK$28.85. International
tourist arrivals showed uninterrupted growth and persistent growth is
expected. Though the Company has a high visibility for its medium term
top-line growth and profitability, we downgrade the Company’s rating due to a
rich valuation. We raise our TP to HK$28.85, representing 24.6x and 21.1x
FY15 and FY16 PER respectively, to factor in increased industry valuation.
评级:
收集 (下调)
6-18m TP 目标价:
HK$28.85
Revised from 原目标价:
HK$27.68
Share price 股价:
HK$26.700
Stock performance
股价表现
25.0
% of return
20.0
15.0
10.0
5.0
0.0
(5.0)
Mar-14 May14
2014 年营收同比增加 15.4%至
至 23.5 亿美元,
亿美元,符合我们和市场预期。
符合我们和市场预期。然而,净利同比增长
Jul-14 Aug-14 Oct-14 Dec-14 Jan-15 Mar-15
HSI Index
Samsonite
北美继续为增长最快的市场,由收购驱动,营收同比增长 22.5%。
Change in Share Price
股价变动
Abs. %
绝对变动 %
Rel. % to HS index
相对恒指变动 %
Avg. share price(HK$)
平均股价(港元)
2014 年毛利率同比下跌 0.5 个百分点至 52.9%,
,符合预期。
符合预期。毛利率的下跌主要是因为北美
销售贡献的提升,由于采用批发模型,该区域的毛利率较低。毛利率的下跌也部分反应了
新收购的 Speck 品牌。
降评级至“
降评级至“收集”
收集”,但提升目标价至 28.85 港元。
港元。国际旅游人数呈不断增长之势,持续增长
1M
1 个月
3M
3 个月
1Y
1年
9.2
15.6
16.1
10.6
10.6
1.8
25.6
24.3
24.8
Source: Bloomberg, Guotai Junan Int ernat ional.
可期。虽然公司在中期营收和收益有高可见度,但由于充实的估值,我们下调公司的评级。
我们上调目标价至每股 28.85 港元,分别相当于 24.6 倍和 21.1 倍 2015 年和 2016 年市盈
Samsonite 新秀丽 (01910 HK)
5.8%至 1.86 亿美元,分别比我们和市场预期低 8.9%和 10.9%,原因是收购费用高于预期。
Year End
Turnover
Net Profit
EPS
EPS
PER
BPS
PBR
DPS
Yield
ROE
收入
股东净利
每股净利
每股净利变动
市盈率
每股净资产
市净率
每股股息
股息率
净资产收益率
(US$ m)
(US$ m)
(US$)
(△%)
(x)
(US$)
(x)
(US$)
(%)
(%)
2,038
176
0.125
18.6
27.5
0.848
4.1
0.057
1.7
15.7
FY14A
2,351
186
0.132
5.7
26.0
0.902
3.8
0.063
1.8
15.1
FY15F
2,644
213
0.151
14.4
22.8
0.991
3.5
0.076
2.2
16.0
FY16F
2,979
249
0.177
16.8
19.5
1.092
3.1
0.088
2.6
17.0
FY17F
3,289
289
0.205
15.9
16.8
1.208
2.8
0.102
3.0
17.8
年结
12/31
FY13A
Shares in issue (m) 总股数 (m)
Market cap. (HK$ m) 市值 (HK$ m)
3 month average vol. 3 个月平均成交股数 (‘000)
52 Weeks high/low (HK$) 52 周高/低
1,408.2
37,600.0
4,340.8
28.050 / 21.900
Major shareholder 大股东
JPMorgan Chase & Co. 12.0%
Free float (%) 自由流通比率 (%)
95.1
FY15 Net gearing (%) 15 年净负债/股东资金 (%)
Net Cash
FY15 Est. NAV (HK$) FY15 每股估值(港元)
28.1
Source: the Company, Guotai Junan International.
See the last page for disclaimer
Page 1 of 7
Company Report
率以反映行业估值的提升。
FY14 top-line met estimates. Samsonite (the “Company”)’s FY14 revenue increased by 15.4% YoY to US$2.35 bn, which
was in line with our estimate and market consensus. However, net profit increased by 5.8% YoY to US$186 mn which was
and Gregory brands were acquired in 2014 and have contributed to the sales growth. North America, though being a mature
market, continued to be the fastest growing market with a YoY increase of 22.5% in sales, driven by acquisitions. Excluding
acquisitions, sales increased by 7.3% on a constant currency basis. Asia continued to be the second fastest growing market
with a YoY increase of 16.1% in sales, driven by American Tourister, Samsonite Orgional and Samsonite Red. The region
24 March 2015
8.9% and 10.9% lower than our estimate and market consensus due to higher than expected acquisition costs. Lipault, Speck
continued to be the region contributing the largest sales, 38.0% of total sales. Sales in Europe increased by 8.3% YoY driven
by accelerated American Tourister brand penetration in the region. Latin America was the slowest growing market with a YoY
increase of 5.7% in sales due to continued import restrictions imposed by Argentina government and currency headwinds.
Excluding Argentina, sales growth in Latin America was 20.0% on a constant currency basis. We reiterate optimism on the
Company’s strategy of leveraging its global supply chain and global brand management experience to accelerate the
geographical penetration of newly acquired and developed brands.
Gross margin decreased by 0.5 ppt YoY to 52.9% for FY14. Gross margin was in line with our expectation and slightly
higher than the market expectation. The drop in gross margin was mainly due to a higher sales contribution from North
America, where a lower gross margin was yield due to the adoption of a wholesale model. The acquired Speck Products was
also attributable to the drop in gross margin. Crude oil price slumped in 4Q14 and continued to be weak in 1Q15. However, as
about 80% of the product manufacturing was outsourced and a multiple-layer structure of its supply chain, the drop in raw
material price cannot match the crude oil decline and it would take several months to materialize the savings. Gross margin for
FY15 is expected to be flat comparing to FY14. The plan of gradually shifting to more direct-to-consumer channels is a positive
to the gross margin in the medium term.
FY13
2,038
(949)
1,088
(670)
(133)
(4)
281
270
(73)
176
0.125
FY14
2,351
(1,107)
1,244
(771)
(151)
(22)
299
282
(77)
186
0.132
YoY
15.4%
16.6%
14.3%
15.1%
13.6%
436.3%
6.4%
4.5%
5.6%
5.8%
5.7%
% of our estimation
100.4%
100.5%
100.2%
101.0%
100.8%
373.0%
93.0%
89.9%
90.8%
91.1%
91.1%
Gross margin
Operating margin
Net margin
53.4%
13.8%
8.6%
52.9%
12.7%
7.9%
-0.5
-1.1
-0.7
-0.1
-1.0
-0.8
% of the consensus
100.5%
100.9%
92.5%
89.1%
89.1%
87.6%
Samsonite 新秀丽 (01910 HK)
Table-1: 2014 Results Analysis
US$ mn
Turnover
Cost of sales
Gross profit
Selling and distribution expenses
Administrative expenses
Other expenses
Profit from operations
Profit before taxation
Income tax
Profit attributable to equity shareholders
Basic EPS (US$)
(ppts)
0.2
-1.1
-1.0
Company Report
Source: the Company, Bloomberg, Guotai Junan International.
See the last page for disclaimer
Page 2 of 7
Figure-1: Samsonite’s Revenue Growth
35.00%
3,000
30.00%
2,500
25.00%
2,000
20.00%
1,500
15.00%
1,000
10.00%
500
24 March 2015
US$ mn
3,500
5.00%
0
0.00%
2011A
2012A
2013A
Revenue (LHS)
2014A
2015F
2016F
2017F
Revenue growth YoY (RHS)
Source: the Company, Guotai Junan International.
Table-2: Sales Contribution by Product Categories
Net sales by product category
2014
2013
2012
2011
2010
1,654,402
1,515,852
1,357,054
1,186,683
885,944
70%
74%
77%
76%
73%
252,069
205,871
109,743
81,849
112,213
11%
10%
6%
5%
9%
256,228
193,474
189,561
189,582
110,321
Travel
% of sales
Casual
% of sales
Business
% of sales
Accessories
11%
9%
11%
12%
9%
147,222
85,745
79,662
70,786
50,186
% of sales
Other
6%
4%
4%
5%
4%
40,786
36,870
35,706
36,247
56,643
% of sales
Net sales
2%
2%
2%
2%
5%
2,350,707
2,037,812
1,771,726
1,565,147
1,215,307
Source: the Company.
Figure-2: Net Sales by Region, 2014
Figure-3: Net Sales by Region, 2013
5.6%
6.1%
Asia
Asia
23.7%
38.0%
North America
North America
Europe
Europe
Latin America
Latin America
Corporate
Corporate
32.4%
30.5%
Source: the Company.
Company Report
Source: the Company.
37.7%
25.3%
Samsonite 新秀丽 (01910 HK)
(US$'000):
See the last page for disclaimer
Page 3 of 7
55%
16.0%
55%
14.0%
54%
12.0%
24 March 2015
Figure-4: Samsonite’s Profitability
10.0%
54%
8.0%
53%
6.0%
53%
4.0%
52%
2.0%
52%
0.0%
2011A 2012A 2013A 2014A 2015F 2016F 2017F
Gross margin (LHS)
Operating margin (RHS)
Net margin (RHS)
Source: the Company, Guotai Junan International.
Well managed SG&A spending. Advertising spend as percentage of sales decrease slightly from 6.3% for FY13 to 6.2% for
FY14. Overall SG&A as percentage of sales dropped slightly from 39.4% for FY13 to 39.2% for FY14.
Effective tax rate up 0.3 ppt YoY to 27.3%. The increase in effective tax rate was mainly due to increased withholding taxes
on dividend and royalty income. The management was confident to achieve a lower effective tax rate of around 26.0% for
FY15.
Stable dividend payment. A total of US$88.0 mn dividend payment was proposed, a YoY increase of 10.0%. The dividend
payout ratio was 47.2% for FY14, comparing to 45.4% for FY13. The Company’s dividend policy was to maintain an
approximately 50.0% of dividend payout ratio in the medium term.
Table-3: Key Assumptions and Adjustments
Total revenue
Asia
OLD
CHANGE
2015F
2016F
2017F
2015F
2016F
2015F
2016F
2,644
2,979
3,289
2,666
3,002
-0.9%
-0.8%
0.6%
1,010
1,145
1,275
1,011
1,139
-0.1%
North America
886
1,010
1,142
868
981
2.1%
3.0%
Europe
601
658
699
628
698
-4.3%
-5.7%
Latin America
138
157
166
152
177
-8.7%
-11.1%
8
8
7
8
8
1.1%
1.1%
1,399
1,582
1,760
1,421
1,603
-1.6%
-1.3%
Operating profit
326
378
434
350
399
-7.0%
-5.3%
Net profit
213
249
289
224
256
-4.8%
-2.9%
0.151
0.177
0.205
0.159
0.182
-4.8%
Others
Gross profit
Basic EPS (US$)
Samsonite 新秀丽 (01910 HK)
NEW
US$ mn
-2.9%
(ppts)
Gross profit margin
52.9%
53.1%
53.5%
53.3%
53.4%
(0.4)
(0.3)
Operating profit margin
12.3%
12.7%
13.2%
13.1%
13.3%
(0.8)
(0.6)
% SG&A of total turnover
40.0%
40.0%
40.0%
40.0%
40.0%
0.0
0.0
Effective tax rate
26.0%
26.0%
26.0%
27.0%
27.0%
(1.0)
(1.0)
Net profit margin
8.1%
8.4%
8.8%
8.4%
8.5%
(0.3)
(0.2)
Source: Guotai Junan International.
Downgrade to “Accumulate” but raise TP to HK$28.85. International tourist arrivals showed uninterrupted growth and
we downgrade the Company’s “Buy” rating to “Accumulate” due to recent outperformance against the market and a rich
valuation. We raise our TP from HK$27.68 to HK$28.85, representing 24.6x and 21.1x FY15 and FY16 PER respectively, to
factor in increased industry valuation.
See the last page for disclaimer
Page 4 of 7
Company Report
persistent growth is expected. Though the Company has a high visibility for its medium term top-line growth and profitability,
Company
Stock
Code Currency
Luggage
SAMSONITE
1910 HK
TUMI
TUMI US
Simple Average
Weighted Average
Luxury Brands
1913 HK
PRADA*
LVMH
MC FP
CHRISTIAN
CDI FP
DIOR
KERING
KER FP
MICHAEL
KORS US
KORS*
BURBERRY
BRBY LN
COH US
COACH*
HUGO BOSS
BOSS GY
SALVATORE
SFER IM
FERRAGAMO
TOD'S
TOD IM
Simple Average
Weighted Average
Sportswear
NKE US
NIKE*
ADIDAS
ADS GR
UNDER
UA US
ARMOUR
Simple Average
Weighted Average
Overall
Simple Average
Weighted Average
Market
Cap
Last
price HK$ mn
PE(x)
PB(x)
D/Y(%)
EV/
EBITDA(x)
Gross
Margin(%)
Operating
Margin(%)
14F
14F
14F
14F
14F
13A
14F
15F
16F
13A
14F
37,600
12,401
27.5
29.5
28.5
28.0
26.1
27.7
26.9
26.5
21.1
24.3
22.7
21.9
17.8
20.9
19.4
18.6
4.1
4.3
4.2
4.1
3.8
3.7
3.8
3.8
3.4
3.2
3.3
3.4
3.1
2.8
2.9
3.0
15.1
14.6
14.9
15.0
2.1
0.0
1.1
1.6
11.8
13.9
12.9
12.3
52.9
58.0
55.5
54.2
12.7
17.7
15.2
14.0
HKD
EUR
51.40 131,524
165.55 705,536
31.1
24.1
33.1
14.7
29.5
21.1
26.0
19.2
5.6
3.1
5.4
3.9
4.8
3.2
4.4
3.0
16.7
23.2
1.5
2.4
11.9
9.3
73.8
64.7
26.2
19.6
EUR
173.25 262,529
21.7
21.7
16.9
15.6
2.8
2.6
2.3
2.3
12.4
2.1
6.9
65.8
19.5
EUR
191.00 202,458
18.8
45.5
17.7
15.8
2.3
2.3
2.1
1.9
5.0
2.5
13.4
62.7
15.5
USD
66.13 102,965
15.9
15.4
13.8
12.3
6.2
5.9
4.4
3.4
41.0
0.0
16.5
60.9
30.5
HKD
USD
26.70
23.56
15F 16F
ROE(%)
GBp 1,843.00
USD
41.58
EUR
116.05
94,529
88,951
68,585
31.6
165.5
24.3
25.0
22.0
24.0
24.2
20.7
20.5
21.7
17.5
18.7
8.0
4.6
11.2
7.0
4.5
9.5
5.9
4.2
8.5
5.2
3.6
7.5
29.6
32.4
42.8
2.3
3.9
3.6
9.6
6.7
12.3
71.2
68.6
66.1
20.1
23.3
17.5
EUR
29.34
41,480
32.9
31.6
27.4
23.8
13.5
10.6
8.6
7.1
37.7
2.1
17.8
63.7
18.4
EUR
86.80
22,304
19.9
38.6
31.0
27.4
26.0
22.7
23.7
21.6
20.6
21.4
19.2
18.5
3.3
6.1
4.3
3.3
5.5
4.3
3.1
4.7
3.7
2.9
4.1
3.3
12.1
25.3
21.8
2.8
2.3
2.3
10.9
11.5
10.3
76.0
67.4
65.9
15.3
20.6
20.3
USD
EUR
101.98 683,312
68.53 120,361
29.1
18.2
28.7
29.2
25.7
20.4
22.2
17.5
7.2
2.6
7.1
2.5
6.5
2.4
5.7
2.2
24.5
8.8
1.2
2.0
15.0
9.3
44.8
47.6
13.2
6.1
USD
81.43 136,076
52.9
83.1
74.2
56.8
8.2
12.9
13.1 10.8
17.3
0.0
33.4
49.0
11.5
33.4
31.2
47.0
36.7
40.1
32.0
32.2
26.6
6.0
6.7
7.5
7.3
7.3
6.9
6.3
6.0
16.9
21.5
1.1
1.1
19.2
17.0
47.1
45.8
10.3
12.1
26.5
24.0
28.9
23.0
24.9
21.8
21.0
18.9
5.1
4.8
5.1
4.7
4.4
4.1
3.9
3.7
20.1
20.0
1.5
1.8
14.9
13.2
56.3
58.8
15.7
17.1
24 March 2015
Table-4: Peer Comparison
Company Report
Samsonite 新秀丽 (01910 HK)
Source: Bloomberg, Guotai Junan International. All forecasts are based on Bloomberg consensus.
* Note: The financial year end dates of these companies are not 31st December. For easier comparison with peers, “13A” means “FY14A” and “14F” means FY15F
and so on.
See the last page for disclaimer
Page 5 of 7
Financial Statements and Ratios
FY15F
FY16F
FY17F
Turnover
2,038
2,351
2,644
2,979
3,289
Cost of sales
(949)
(1,107)
(1,245)
(1,397)
(1,530)
Gross profit
1,088
1,244
1,399
1,582
1,760
As at Dec 31 (US$ mn)
FY13A
FY14A
FY15F
FY16F
FY17F
PP&E
155
Goodwill
214
178
211
243
276
270
270
270
270
Other intangible assets
663
767
757
747
737
67
81
77
74
68
1,100
1,296
1,315
1,334
1,351
Inventory
298
332
380
427
525
Others
Distribution costs
(541)
(626)
(693)
(780)
(862)
Marketing expenses
(129)
(145)
(196)
(220)
(243)
Administrative & general
expenses
(137)
(174)
(185)
(203)
(221)
281
299
326
378
434
Trade and other receivables
246
291
322
363
404
Prepaid expenses and other
assets
Cash balance
65
72
72
72
72
225
140
233
312
438
Total current assets
835
835
1,007
1,173
1,440
Trade and bill payables
387
415
512
575
707
Operating profit
Total non-current assets
Net finance cost
(11)
(17)
(8)
(7)
(4)
Profit before tax
270
282
317
371
430
Income tax
(73)
(77)
(83)
(96)
(112)
Minority interest
(21)
(19)
(22)
(26)
(30)
Bank loans
14
65
46
32
22
Net profit
176
186
213
249
289
Current tax liabilities
46
61
61
61
61
Employee benefits
54
62
56
50
45
502
604
674
718
835
Non-controlling interest put
options
53
58
58
58
58
Employee benefits
EPS (US$)
0.125
0.132
0.151
0.177
0.205
YoY
18.6%
5.7%
14.4%
16.8%
15.9%
DPS (US$)
0.057
0.063
0.076
0.088
0.102
Total current liabilities
33
50
45
40
36
Deferred tax liabilities &
other liabilities
116
112
117
121
127
Total non-current liabilities
203
220
215
215
216
Minority interest
Shareholders' equities
38
1,193
38
1,270
38
1,395
38
1,537
38
1,701
BPS (US$)
0.848
0.902
0.991
1.092
1.208
Cash Flow Statement
Year end Dec (US$ mn)
Financial Ratio
FY13A
FY14A
FY15F
FY16F
FY17F
Profit for the year
197
205
235
274
318
Depreciation and
amortization
45
52
59
67
75
Others
61
85
71
86
103
Working capital change
(48)
(36)
17
(24)
(8)
Tax & interest paid
(62)
(76)
(91)
(103)
(116)
Operating cash flow
193
230
292
300
373
Purchase of PP&E
FY13A
FY14A
FY15F
FY16F
FY17F
Revenue growth (%)
15.0
15.4
12.5
12.7
10.4
Operating profit growth (%)
16.4
6.4
8.8
16.0
14.9
Net profit growth (%)
18.6
5.8
14.4
16.8
15.9
Gross margin (%)
53.4
52.9
52.9
53.1
53.5
Operating margin (%)
13.8
12.7
12.3
12.7
13.2
Net profit margin (%)
8.6
7.9
8.1
8.4
8.8
(57)
(70)
(82)
(89)
(99)
Other investing activities
0
(197)
0
0
0
ROE (%)
15.7
15.1
16.0
17.0
17.8
Other proceeds
3
(1)
0
0
0
ROA (%)
9.4
9.2
9.6
10.3
10.9
Investing cash flow
(54)
(267)
(82)
(89)
(99)
Inventory turnover days
110.7
104.0
104.4
105.4
113.6
Dividend paid
(38)
(80)
(88)
(107)
(124)
Account receivable days
42.0
41.7
42.3
42.0
42.5
Other financing activities
(27)
38
(29)
(25)
(23)
Account payable days
144.1
132.3
135.9
141.9
152.9
Financing cash flow
(65)
(42)
(117)
(132)
(147)
Cash conversion cycle
8.5
13.3
10.8
5.5
3.2
Cash at beginning of year
151
225
140
233
312
Current ratio (x)
1.7
1.4
1.5
1.6
1.7
74
(79)
92
79
127
Payout ratio (%)
45.4
47.2
50.0
50.0
50.0
Net gearing (%)
Net
cash
Net
cash
Net
cash
Net
cash
Net
cash
Change in cash and cash
equivalent
Cash balance at year end
225
140
233
312
438
Source: the Company, Guotai Junan International.
See the last page for disclaimer
Page 6 of 7
24 March 2015
Balance Sheet
FY14A
Samsonite 新秀丽 (01910 HK)
FY13A
Company Report
Income Statement
Year end Dec (US$ mn)
Company Rating Definition
The Benchmark: Hong Kong Hang Seng Index
Rating
Definition
Buy
Relative Performance >15%;
or the fundamental outlook of the company or sector is favorable.
Relative Performance is 5% to 15%;
or the fundamental outlook of the company or sector is favorable.
Accumulate
Neutral
Relative Performance is -5% to 5%;
or the fundamental outlook of the company or sector is neutral.
Reduce
Relative Performance is -5% to -15%;
or the fundamental outlook of the company or sector is unfavorable.
Sell
Relative Performance <-15%;
or the fundamental outlook of the company or sector is unfavorable.
24 March 2015
Time Horizon: 6 to 18 months
Sector Rating Definition
The Benchmark: Hong Kong Hang Seng Index
Time Horizon: 6 to 18 months
Rating
Outperform
Definition
Relative Performance >5%;
or the fundamental outlook of the sector is favorable.
Neutral
Relative Performance is -5% to 5%;
or the fundamental outlook of the sector is neutral.
Underperform
Relative Performance <-5%;
or the fundamental outlook of the sector is unfavorable.
(1)
(2)
(3)
(4)
The Analysts and their associates do not serve as an officer of the issuer mentioned in this Research Report.
The Analysts and their associates do not have any financial interests in relation to the issuer mentioned in this Research Report.
Except for Shandong Chenming Paper Holdings Limited-H shares (01812), China All Access (Holdings) Limited (00633), Guangshen
Railway Company Limited-H share (00525), Guotai Junan International Holdings Limited (01788) and Binhai Investment Company
Limited (02886), Guotai Junan and its group companies do not hold equal to or more than 1% of the market capitalization of the issuer
mentioned in this Research Report.
Guotai Junan and its group companies have not had investment banking relationships with the issuer mentioned in this Research Report
within the preceding 12 months.
DISCLAIMER
This Research Report does not constitute an invitation or offer to acquire, purchase or subscribe for securities by Guotai Junan Securities
(Hong Kong) Limited ("Guotai Junan"). Guotai Junan and its group companies may do business that relates to companies covered in
research reports, including investment banking, investment services and etc. (for example, the placing agent, lead manager, sponsor,
underwriter or invest proprietarily).
Samsonite 新秀丽 (01910 HK)
DISCLOSURE OF INTERESTS
Any opinions expressed in this report may differ or be contrary to opinions or investment strategies expressed orally or in written form by sales
persons, dealers and other professional executives of Guotai Junan group of companies. Any opinions expressed in this report may differ or
be contrary to opinions or investment decisions made by the asset management and investment banking groups of Guotai Junan.
Though best effort has been made to ensure the accuracy of the information and data contained in this Research Report, Guotai Junan does
not guarantee the accuracy and completeness of the information and data herein. This Research Report may contain some forward-looking
estimates and forecasts derived from the assumptions of the future political and economic conditions with inherently unpredictable and
mutable situation, so uncertainty may contain. Investors should understand and comprehend the investment objectives and its related risks,
and where necessary consult their own financial advisers prior to any investment decision.
This Research Report is not directed at, or intended for distribution to or use by, any person or entity who is a citizen or resident of or located
in any jurisdiction where such distribution, publication, availability or use would be contrary to applicable law or regulation or which would
subject Guotai Junan and its group companies to any registration or licensing requirement within such jurisdiction.
See the last page for disclaimer
Company Report
© 2015 Guotai Junan Securities (Hong Kong) Limited. All Rights Reserved.
27/F., Low Block, Grand Millennium Plaza, 181 Queen’s Road Central, Hong Kong.
Tel.: (852) 2509-9118
Fax: (852) 2509-7793
Website: www.gtja.com.hk
Page 7 of 7


