pH of Two Lakes Graphing Activity Chemistry 2 points (one for
advertisement
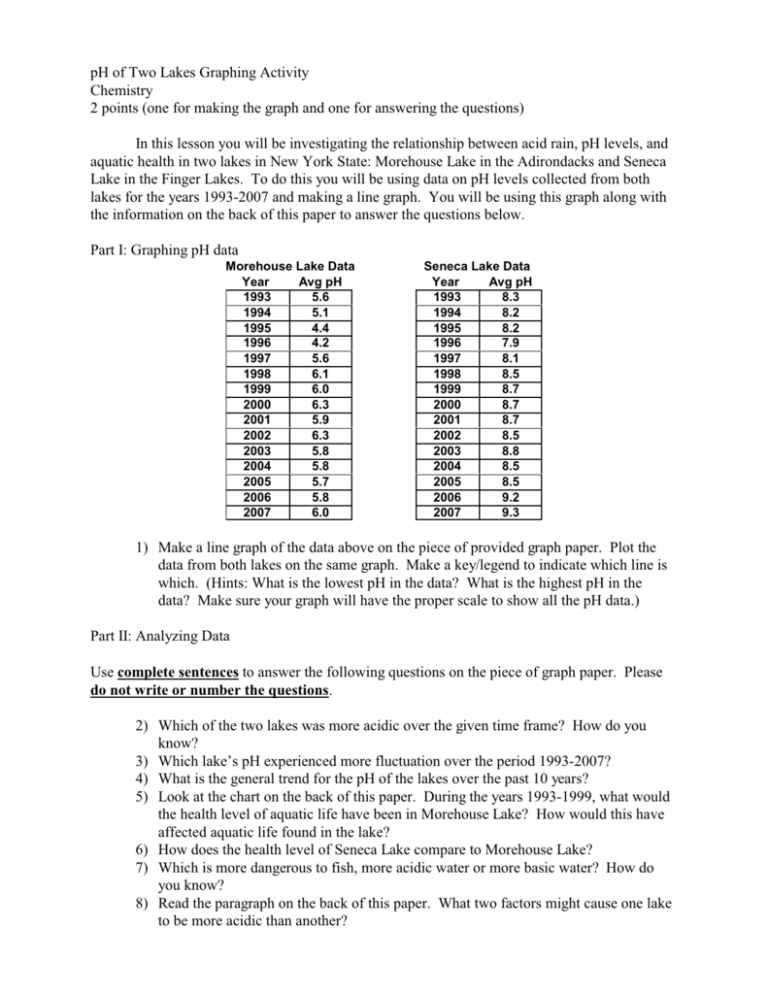
pH of Two Lakes Graphing Activity Chemistry 2 points (one for making the graph and one for answering the questions) In this lesson you will be investigating the relationship between acid rain, pH levels, and aquatic health in two lakes in New York State: Morehouse Lake in the Adirondacks and Seneca Lake in the Finger Lakes. To do this you will be using data on pH levels collected from both lakes for the years 1993-2007 and making a line graph. You will be using this graph along with the information on the back of this paper to answer the questions below. Part I: Graphing pH data Morehouse Lake Data Year Avg pH 1993 5.6 1994 5.1 1995 4.4 1996 4.2 1997 5.6 1998 6.1 1999 6.0 2000 6.3 2001 5.9 2002 6.3 2003 5.8 2004 5.8 2005 5.7 2006 5.8 2007 6.0 Seneca Lake Data Year Avg pH 1993 8.3 1994 8.2 1995 8.2 1996 7.9 1997 8.1 1998 8.5 1999 8.7 2000 8.7 2001 8.7 2002 8.5 2003 8.8 2004 8.5 2005 8.5 2006 9.2 2007 9.3 1) Make a line graph of the data above on the piece of provided graph paper. Plot the data from both lakes on the same graph. Make a key/legend to indicate which line is which. (Hints: What is the lowest pH in the data? What is the highest pH in the data? Make sure your graph will have the proper scale to show all the pH data.) Part II: Analyzing Data Use complete sentences to answer the following questions on the piece of graph paper. Please do not write or number the questions. 2) Which of the two lakes was more acidic over the given time frame? How do you know? 3) Which lake’s pH experienced more fluctuation over the period 1993-2007? 4) What is the general trend for the pH of the lakes over the past 10 years? 5) Look at the chart on the back of this paper. During the years 1993-1999, what would the health level of aquatic life have been in Morehouse Lake? How would this have affected aquatic life found in the lake? 6) How does the health level of Seneca Lake compare to Morehouse Lake? 7) Which is more dangerous to fish, more acidic water or more basic water? How do you know? 8) Read the paragraph on the back of this paper. What two factors might cause one lake to be more acidic than another? pH and Effect on Aquatic Organisms Health Level pH Effect 1 3.0 - 3.5 Unlikely that fish can survive for more than a few hours in this range. 2 3.5-4.0 Known to be lethal to salmon species. 3 4.0-4.5 All fish, most frogs, and insects are absent. 4 4.5-5.0 Mayfly and many other insects absent. Most fish eggs will not hatch. 5 5.0-5.5 Bottom-dwelling bacteria (decomposers) begin to die. Leaf litter and detritus begin to accumulate, locking up essential nutrients and interrupting chemical cycling. Plankton begin to disappear. Snails and clams absent. Mats of fungi begin to replace bacteria in the substrate. Metals (aluminum, lead) normally trapped in sediments are released in the acidified water, which are toxic to aquatic life. 6 6.0-6.5 Freshwater shrimp absent. Unlikely to be directly harmful to fish. 7 6.5-8.2 Optimal range for most organisms. 8 8.2-9.0 Unlikely to be directly harmful to fish. Indirect effects could occur due to chemical changes of the water. 9 9.0-10.5 Likely to be harmful to salmon species and perch if level persists. 10 10.5-11.0 Rapidly lethal to salmon species. Prolonged exposure is lethal to species such as carp and perch. 11 Source: 11.0-11.5 Lethal to all species of fish. Center for Earth and Environmental Science at Indiana University–Purdue University Indianapolis. Acid Rain and the Environment When acid rain falls to the earth it interacts with landscape features which affects how it will impact the environment. Much of the research on the detrimental effects of acid rain has been conducted in the Adirondack region of New York State because of the igneous/metamorphic nature of the underlying bedrock in this region. Soils in the Adirondacks (where Morehouse Lake is located) are thin, slightly acidic, and lack the ability to neutralize the inputs from acid rain. In the Finger Lakes region (where Seneca Lake is), however, calcareous soils and limestone outcrops which contain CaCO3 (calcium carbonate) are dominant in the landscape and provide a “buffer” against acid rain. Source: Lajewski, C.K., et. al. Geological Society of America Bulletin 2003. *This activity is based on a lesson and data from Hobart and William Smith Colleges’ Science on Seneca website: http://www.hws.edu/fli/lessons_teach_acid_rain.aspx*
