Apr 09, 2015
Zacks Rank 4-Sell
Walgreens Boots Alliance (NASD: WBA)
$87.68
Style Scores: Growth:
USD ( As of 04/08/15 )
20 Day Average Volume
Beta
Market Cap
Dividend / Div Yld
Industry
Industry Rank
$88.23 - $59.04
6,223,513
1.38
95.13 B
$1.35 / 1.55%
RETAIL-DRUG STR
75 / 265 (Top 28%)
Growth Score
Hist. EPS Growth (3-5 yrs)
10.51%
Proj. EPS Growth (F1/F0)
10.37%
Curr. Cash Flow Growth
5.06%
Hist. Cash Flow Growth (3-5 yrs)
8.49%
Current Ratio
Debt/Capital
Net Margin
Return on Equity
Sales/Assets
Proj. Sales Growth (F1/F0)
EV/EBITDA
PEG Ratio
Price/Book (P/B)
Agreement
Estimate Revisions (60 days)
100%
100%
100%
100%
2.64%
15.54%
1.94
Q1 (Current Qtr)
Q2 (Next Qtr)
F1 (Current Year)
F2 (Next Year)
Revisions: 2
Revisions: 2
Revisions: 2
Revisions: 2
Up: 0 Down: 2
Up: 0 Down: 2
Up: 0 Down: 2
Up: 0 Down: 2
41.37%
Magnitude Consensus Estimate Trend (60 days)
0.13
19.25
2.10
4.01
18.79
P/E (F1)
24.31
Earnings Yield
Elements of the Zacks Rank
2.36
Price/Cash Flow (P/CF)
Price/Sales (P/S)
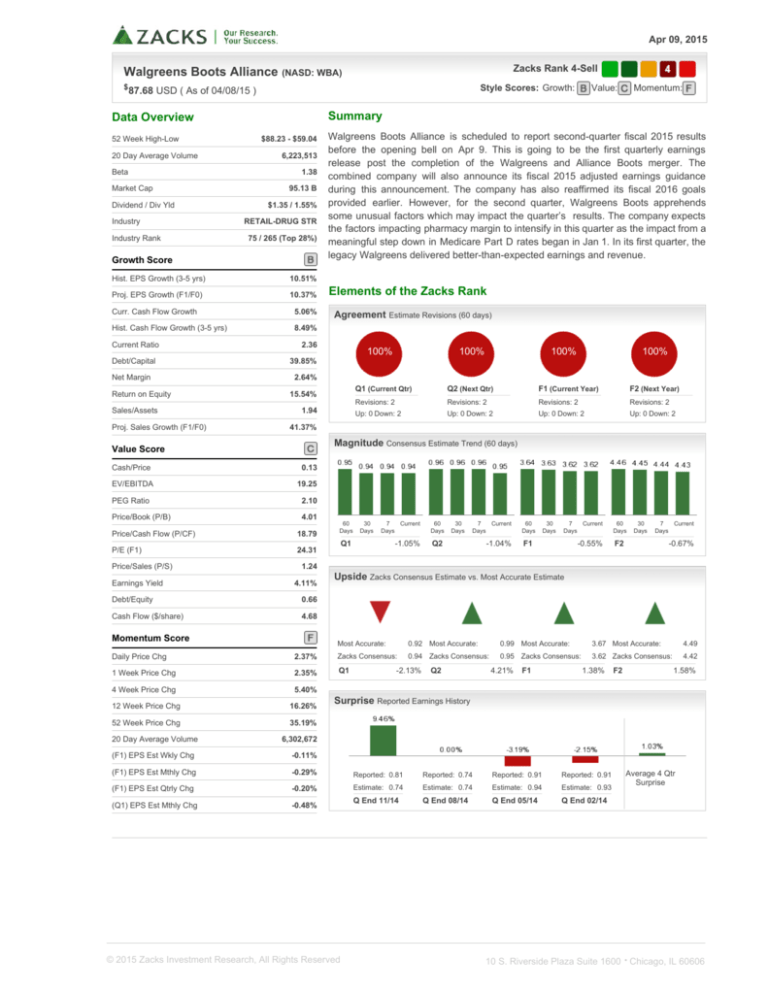
Walgreens Boots Alliance is scheduled to report second-quarter fiscal 2015 results
before the opening bell on Apr 9. This is going to be the first quarterly earnings
release post the completion of the Walgreens and Alliance Boots merger. The
combined company will also announce its fiscal 2015 adjusted earnings guidance
during this announcement. The company has also reaffirmed its fiscal 2016 goals
provided earlier. However, for the second quarter, Walgreens Boots apprehends
some unusual factors which may impact the quarter’s results. The company expects
the factors impacting pharmacy margin to intensify in this quarter as the impact from a
meaningful step down in Medicare Part D rates began in Jan 1. In its first quarter, the
legacy Walgreens delivered better-than-expected earnings and revenue.
39.85%
Value Score
Cash/Price
Momentum:
Summary
Data Overview
52 Week High-Low
Value:
60
Days
30
Days
7
Current
Days
60
Days
-1.05%
Q2
Q1
30
Days
7
Current
Days
-1.04%
60
Days
30
Days
7
Current
Days
F1
-0.55%
60
Days
30
Days
7
Current
Days
F2
-0.67%
1.24
4.11%
Debt/Equity
0.66
Cash Flow ($/share)
4.68
Momentum Score
Upside Zacks Consensus Estimate vs. Most Accurate Estimate
Most Accurate:
0.92 Most Accurate:
0.99 Most Accurate:
3.67 Most Accurate:
Daily Price Chg
2.37%
Zacks Consensus:
0.94 Zacks Consensus:
0.95 Zacks Consensus:
3.62 Zacks Consensus:
1 Week Price Chg
2.35%
Q1
4 Week Price Chg
12 Week Price Chg
52 Week Price Chg
20 Day Average Volume
-2.13%
Q2
4.21%
F1
1.38%
F2
4.49
4.42
1.58%
5.40%
16.26%
Surprise Reported Earnings History
35.19%
6,302,672
(F1) EPS Est Wkly Chg
-0.11%
(F1) EPS Est Mthly Chg
-0.29%
Reported: 0.81
Reported: 0.74
Reported: 0.91
Reported: 0.91
(F1) EPS Est Qtrly Chg
-0.20%
Estimate: 0.74
Estimate: 0.74
Estimate: 0.94
Estimate: 0.93
(Q1) EPS Est Mthly Chg
-0.48%
Q End 11/14
Q End 08/14
Q End 05/14
Q End 02/14
© 2015 Zacks Investment Research, All Rights Reserved
Average 4 Qtr
Surprise
10 S. Riverside Plaza Suite 1600 · Chicago, IL 60606
The data on the front page and all the charts in the report represent market data as of 04/08/15, while the reports text is as of
04/09/2015
Overview
Founded in Dec 2014, Walgreens Boots Alliance (WBA) is the
world’s first pharmacy-led, health and wellbeing enterprise. The
company has been formed through the combination of
Walgreens Co. (WAG) and Alliance Boots that brought together
two leading companies with iconic brands, complementary
geographic footprints, shared values, and trusted health care
services through pharmaceutical wholesaling and community
pharmacy care.
The company includes the largest global pharmaceutical
wholesaler and distribution network with over 340 distribution
centers in 19 countries. In addition, Walgreens Boots Alliance is
the world's largest purchaser of prescription drugs and several
other health and wellbeing products. Its portfolio of retail and
business brands includes Walgreens, Duane Reade, Boots and
Alliance Healthcare, as well as global health and beauty product
brands, such as No7 and Botanics that are gaining popularity.
On Dec 31, 2014, Walgreens and Alliance Boots completed Step
2 of their strategic partnership to form Walgreens Boots Alliance,
following the approval by the former’s shareholders on Dec 29.
The new global enterprise combines Walgreens, the largest
drugstore chain in the USA; Boots, a leading European retail
pharmacy and Alliance Healthcare, a major international
wholesaler and distributor.
Walgreens is now a fully-owned subsidiary of the new company, which will be headquartered in Deerfield, IL. Stefano Pessina will
become the acting CEO of Walgreens Boots Alliance, following the retirement of Walgreen’s current CEO Greg Wasson.
Originally, Walgreens and Alliance Boots had entered into a long-term strategic partnership in Jun 2012, with the former acquiring a
45% equity ownership in the latter for about $6.7 billion in cash and stock.
Zacks Equity Research: WBA
www.zacks.com
Page 2 of 8
Reasons To Sell:
Several Headwinds Weigh on Stock: Walgreen is currently challenged by headwinds that
include recent changes in the environment of the company's pharmacy business, ongoing
generic drug inflation, reimbursement pressure and a shift in pharmacy mix toward 90-day
prescription refills at retail locations and Medicare Part D. The generic wave in the
pharmaceutical industry remains a threat to revenues. We are also worried about the fate of the
Alliance Boots deal which remains cloudy ever since the acquisition procedure was initiated.
Although the company has promised successful integration and synergy down the line, nearterm outlook is bleak.
Pressure on Margins Continues: Introduction of generic versions of drugs generally benefits
gross profit margin compared to patent protected brand name drugs. However, in the last few
years, slowdown in generic introduction has been affecting the company’s margins. Besides,
over the past few years, increased reimbursement pressure and generic drug cost inflation
have been hampering Walgreens’ margin, on a significant level. Per management, the fewer
generic drug introductions compared to the prior-year period and the ongoing generic drug
inflation has hindered the quarter’s pharmacy margin. The company expects these negative
factors will continue to adversely impact pharmacy margin in the next quarter as well. However,
management is working tirelessly to increase efficiency and provide high quality and cost
effective pharmacy services, in order to reduce overall pharmacy cost.
Ongoing generic
drug inflation,
reimbursement
pressure and
competitive market
offer tough
challenges for
Walgreens. Also, the
present weak
macroeconomic
environment
prevailing in the U.S.
might hamper the
company’s margin.
Competitive Landscape: Walgreens faces headwinds from increased competition and tough industry conditions. Even though the
company continues to grab market share from other traditional drug store retailers, major mass merchants such as Target and WalMart are expanding their pharmacy businesses and enjoy a fair market share. We note that the retail wing of CVS Caremark
witnessed a record market share gain following the termination of the Walgreens-Express Scripts contract. While the company’s
sluggish performance is showing signs of improving with the return of customers, CVS management commentary of retaining a
majority of the client wins raises our concern. There are also risks from other channels, such as supermarkets and mail order
operations. In addition, industry conditions remain challenging, as insurers reduce reimbursement rates and increase prescription
co-payments.
Additional Challenges: Under the present weak macroeconomic environment, unemployment remains high at 6.1%, and food and
gas prices are on the rise. Increasing costs coupled with unemployment makes the customers more value driven. Consequently,
spending on discretionary items gets affected. We are of the opinion that this situation will impact same store sales growth. Our
proposition is supported by the continued decline in customer traffic in comparable stores.
Risks
Alliance Boots Acquisition, a Major Positive: With the completion of Step 2 of Alliance Boots acquisition, Walgreens has
successfully become a fully-owned subsidiary of the new company called Walgreens Boots Alliance, the first global pharmacy-led
health and wellbeing enterprise. This constitutes a major part of Walgreen’s strategic journey that the company began six years
back, to position orderings for new generation of growth and value creation. Since the strategic partnership started off in 2012,
Walgreens and Alliance Boots have achieved several significant goals including senior leadership exchanges, successful synergy
generation, a joint own-brand sourcing program in Asia and the sharing of best practices and innovative technologies. In addition,
the companies launched No7 and other Boots product brands in Walgreens stores across the U.S. The completion of this
strategic transaction marks another breakthrough for both the companies. The acquisition will greatly expand Walgreen's
international presence. Combining Walgreen, the largest drugstore chain in the U.S.; Boots, the market leader in European retail
pharmacy; and Alliance Healthcare, the leading international wholesaler and distributor, the new entity spans over 25 countries
with more than 12,800 stores, and over 370,000 employees. The merger will also bring together a unique portfolio of retail,
wholesale, service and product brands, alongside the world’s largest pharmaceutical wholesaler and distribution network. Having
attained this global stature, Walgreens will be able to generate significant and sustainable benefits for local markets as well as for
all stakeholders.
Strategic Goal for Next Three Years: While announcing the second step of the Alliance Boots acquisition, Walgreens had also
outlined a new three-year ‘Next Chapter plan’ through fiscal 2017 that will set strategic goals for the combined company and
maximize its scope and scale over time. The plan will reflect significant value-creating opportunities for the combined enterprise to
drive long-term shareholder value. Under this plan, the combined company will establish goals for fiscal 2016 including revenues
between $126 billion and $130 billion and adjusted earnings per share of $4.25 to $4.60. As Walgreens strides on the synergy
track, the company expects to exceed the combined synergy goal of $1 billion by the end of 2016. The plan also focuses on
improving core performance in the near-term.
So far, Walgreens’ partnership with Alliance Boots has been yielding positive results, with combined synergies reaching $491
million in fiscal 2014. Moreover, Alliance Boots contributed $0.06 per share to Walgreens’ fourth-quarter fiscal 2014 adjusted net
earnings. The company expects this joint synergy program to deliver approximately $650 million in fiscal 2015. The company
estimates accretion from Alliance Boots in the first quarter of fiscal 2015 in the range of $0.10 to $0.11 per share (on an adjusted
basis, including a $0.02 benefit related to the Alliance Boots’ acquisition of its partner’s interest in a joint venture). We are
looking forward to all these new ventures at Walgreens and expect them to complement the company’s growth going forward.
Zacks Equity Research: WBA
www.zacks.com
Page 3 of 8
Cost Reduction and Capital Allocation Initiatives: The three-year plan of the combined company also includes a multi-faceted
cost-reduction initiative across the enterprise. This plan includes corporate, field and store-level cost reductions. The company
has already started making significant progress in this matter and expects to begin realizing incremental benefits in fiscal 2015.
Walgreens has also approved a new capital allocation policy for the combined enterprise which is designed to ensure a balanced
and disciplined approach to capital. The company expects this to drive business growth and generate strong returns, while
returning cash to shareholders through dividends and share repurchases over the long term.
Strong Balance Sheet: Walgreens’ cash and cash equivalent at the end of the first quarter of fiscal 2015 was almost $12.86
billion, significantly higher than $969 million as of Nov 30, 2013. Long-term debt was pegged at $13.76 billion in the reported
quarter, compared with $4.5 billion as of Nov 30, 2013. Cash flow trends remain strong as overall networking capital decreased
13.8% on a year-over-year basis, which helped drive solid cash flow performance for the quarter. Operating cash flow for the first
quarter was approximately $1.03 billion compared with $133 million for the same period last year. Notably, year-ago cash flow
was adversely impacted by the timing of payments related to the AmerisourceBergen transaction. Free cash flow for the quarter
was $696 million versus free cash outflow of $231 million a year ago.
The healthy cash balance should support the company’s plans for suitable acquisitions, to drive its revenues going forward. Also,
bolstered by a strong cash position, the company strives to benefit its shareholders through dividend payments and share
repurchases. Walgreens’ strong balance sheet has enabled it to consistently hike dividends. The hike reflects a compound
annual growth rate (CAGR) of 23% over 5 years. It is encouraging to note that the company has been paying dividends for more
than 80 years now and the latest 7.1% hike Walgreens made in Oct 2014 marked the thirty-ninth consecutive quarter of dividend
increase for the company. This hike was in line with its long-term dividend payout ratio of 30% to 35%. In the last fiscal, the
company has returned more than $1 billion to its shareholders via dividends. Going forward, the company plans to review its
capital deployment strategy. Moreover, in addition to the $500 million in shares Walgreens bought back in the fourth quarter of
fiscal 2014, it has bought another $500 million in the reported quarter. These efforts underline the company’s focus toward a
healthy investment grade rating.
Last Earnings Report
Walgreen reported adjusted net earnings of $0.81 per share in the first quarter of fiscal
2015, up 12.5% from the year-ago adjusted number. The adjusted figure also beat the
Zacks Consensus Estimate of $0.74 by 9.5%.
Quarter Ending 11/2014
Report Date
Sales Surprise
A year-over-year high-single-digit increase in the revenues primarily resulted in this bottomline improvement.
In Aug 2012, Walgreens had entered into a strategic partnership with a global international
pharmacy-led health and beauty group Alliance Boots GmbH, in which it acquired a 45%
stake for $6.7 billion. This alliance fits Walgreens' strategy to advance community pharmacy
and bring additional specialty pharmacy products and services closer to patients.
EPS Surprise
NA
NA
9.46%
Quarterly EPS
0.81
Annual EPS (TTM)
3.37
So far, Walgreens' partnership with Alliance Boots has been yielding positive results, with combined synergies reaching $140 million in
the reported quarter. Moreover, Alliance Boots contributed 11 cents per share to Walgreens' first-quarter fiscal 2015 adjusted net
earnings.
The company expects this joint synergy program to deliver approximately $650 million in fiscal 2015.
On a reported basis (including certain one-time items), net earnings came in at $809 million or 85 cents per share, an improvement of
16.4% or 18.1% respectively from the year-ago net earnings of $695 million or 72 cents per share.
Quarter in Detail
During the reported quarter, Walgreens' total sales reached $19.6 billion in the first quarter, registering sales growth of 6.7% year over
year and a comfortable beat over the Zacks Consensus Estimate of $19.4 billion. This sales result came in line with the preliminary
November sales figures posted by Walgreens in the first week of December.
In the reported quarter, Walgreens delivered solid performance across both its pharmacy and retail products businesses, which resulted
in the top-line improvement.
Front-end comparable store (those open for at least a year) sales and basket size grew 1.5% and 4.2%, respectively, in the quarter.
Overall, comparable store sales improved 5.7%. On the other hand, customer traffic in comparable stores was down 2.7%.
Pharmacy sales (accounting for 66.8% of total sales in the quarter) climbed 9% over the prior-year quarter, while pharmacy sales in
comparable stores increased 8.1%. Moreover, Walgreens filled a record 222 million prescriptions (up 4.3% year over year) during the
reported quarter.
Prescriptions filled at comparable stores rose 4.1%. As of Nov 30, Walgreens retail prescription market share on a 30-day adjusted
basis reached 19%, as reported by IMS Health.
Notably, Walgreens has completed its financing to seal the Alliance Boots transaction. The company expects to close the second step
of the transaction on Dec 31, 2014, following the special meeting of shareholders to be held on Dec 29 in New York City.
Zacks Equity Research: WBA
www.zacks.com
Page 4 of 8
Margins
Adjusted gross profit increased 2.6% year over year to $5.35 billion. However, as expected, adjusted gross margin contracted 100 basis
points (bps) to 27.3% as pharmacy gross profit was negatively impacted by lower third-party reimbursement and generic drug price
inflation, partially offset by an increase in the brand-to-generic drug conversions.
However, as expected, both pharmacy and front-end margins gained from purchasing synergies from the company's joint venture with
Alliance Boots.
Adjusted selling, general and administrative (SG&A) expenses scaled up 1.7% to $4.3 billion. Adjusted operating margin remained flat
at 5.2%.
Recent News
Walgreens Boots Alliance is scheduled to report second-quarter fiscal 2015 results before the opening bell on Apr 9 2015. As a
combined company, Walgreens Boots intends to continue reporting comparable sales results on a quarterly basis. However, it has
stopped issuing monthly sales results as it used to do for the legacy company.
On Mar 17, 2015, Walgreens announced the list of states with the highest rates of influenza according to its season-ending Flu Index,
which examined aggregate prescription data from Nov 2014 through Feb 2015. Oklahoma, Mississippi and Tennessee were the states
where in people were affected by influenza at most.
On Feb 20, 2015, Walgreens announced that the company will celebrate the official opening of a new two-story, flagship store at 1488
Kapiolani Blvd., Honolulu, in the popular Ala Moana shopping district on Feb. 21, 2015. The location features an extensive collection of
innovative offerings, products and services unexpected from a drugstore, marking this as Walgreens’ 15th flagship store, and its 12th
store on Oahu and 18th in Hawaii.
Zacks Equity Research: WBA
www.zacks.com
Page 5 of 8
Industry Analysis Zacks Industry Rank: 75 / 265 (Top 28%)
Top Peers
AHOLD N V ADR (AHONY)
ARCOS DORADOS-A (ARCO)
BIOSCRIP INC (BIOS)
CVS HEALTH CORP (CVS)
DIPLOMAT PHARMA (DPLO)
GNC HOLDINGS (GNC)
HERBALIFE LTD (HLF)
CHINA NEPSTAR (NPD)
RITE AID CORP (RAD)
Industry Comparison Retail-drug Str | Position in Industry: 3 of 8
Market Cap
# of Analysts
Dividend Yield
WBA
95.93 B
M Industry
917.87 M
Industry Peers
S&P 500
18.89 B
BIOS
321.22 M
CVS
117.42 B
DPLO
1.87 B
18
6
14
5
18
6
1.53%
0.00%
1.76%
0.00%
1.35%
0.00%
-
-
Growth Score
Hist. EPS Growth (3-5 yrs)
10.51%
11.17%
10.88%
-45.69%
13.99%
NA
Proj. EPS Growth (F1/F0)
10.37%
15.46%
7.06%
88.46%
21.95%
2.45%
Curr. Cash Flow Growth
5.06%
7.22%
7.16%
-511.83%
1.45%
138.91%
Hist. Cash Flow Growth (3-5 yrs)
8.49%
7.13%
10.04%
NA
5.07%
NA
2.36
1.21
1.37
1.16
1.37
1.35
39.85%
25.67%
37.94%
65.87%
23.55%
0.00%
2.64%
3.22%
10.07%
-14.98%
3.33%
NA
15.54%
12.22%
17.09%
-34.38%
13.81%
NA
1.94
1.72
0.60
1.14
1.90
NA
41.37%
%
2.44%
10.49%
7.72%
33.22%
-
-
Current Ratio
Debt/Capital
Net Margin
Return on Equity
Sales/Assets
Proj. Sales Growth (F1/F0)
Value Score
Cash/Price
0.13
0.04
0.06
0.00
0.02
0.01
EV/EBITDA
19.25
12.62
10.95
-11.13
12.40
91.77
PEG Ratio
2.10
1.85
1.81
NA
1.48
2.91
Price/Book (P/B)
4.01
3.75
3.20
1.48
3.12
10.02
Price/Cash Flow (P/CF)
18.79
14.61
12.64
NA
17.26
62.20
P/E (F1)
24.31
26.52
18.64
NA
20.10
65.48
1.24
1.23
2.12
0.33
0.84
NA
4.11%
3.43%
5.34%
-3.63%
4.98%
1.52%
Debt/Equity
0.66
0.27
0.59
1.93
0.31
0.00
Cash Flow ($/share)
4.68
1.73
5.30
-1.03
5.99
0.53
-
-
Daily Price Chg
2.37%
0.00%
0.63%
4.93%
0.70%
-3.01%
1 Week Price Chg
2.35%
0.00%
0.03%
9.09%
-0.39%
-4.84%
4 Week Price Chg
5.40%
0.92%
1.00%
8.84%
0.91%
15.62%
12 Week Price Chg
16.26%
4.70%
3.38%
-17.90%
6.41%
25.32%
52 Week Price Chg
35.19%
6.18%
14.17%
-31.13%
40.09%
NA
6,302,672
292,643
2,309,971
1,998,848
4,187,358
708,005
(F1) EPS Est Wkly Chg
-0.11%
0.00%
0.00%
0.00%
0.00%
0.00%
(F1) EPS Est Mthly Chg
-0.29%
0.00%
0.00%
0.00%
0.00%
0.00%
(F1) EPS Est Qtrly Chg
-0.20%
-1.31%
-1.79%
-633.33%
0.10%
23.04%
(Q1) EPS Est Mthly Chg
-0.48%
0.00%
0.00%
0.00%
0.00%
0.00%
Price/Sales (P/S)
Earnings Yield
Momentum Score
20 Day Average Volume
Zacks Equity Research: WBA
www.zacks.com
Page 6 of 8
Zacks Rank Education
The Zacks Rank is calculated from four primary inputs: Agreement, Magnitude, Upside and Surprise.
Agreement
This is the extent which brokerage analysts are revising their earnings estimates in the same
direction. The greater the percentage of estimates being revised higher, the better the score for this
component.
For example, if there were 10 estimate revisions over the last 60 days, with 8 of those revisions up,
and the other 2 down, then the agreement factor would be 80% positive. If, however, 8 were to the
downside with only 2 of them up, then the agreement factor would be 80% negative. The higher the
percentage of agreement the better.
Magnitude
This is a measure based on the size of the recent change in the current consensus estimates. The
Zacks Rank looks at the magnitude of these changes over the last 60 days.
In the chart to the right, the display shows the consensus estimate from 60-days ago, 30-days ago,
7-days ago, and the most current estimate The difference between the current estimate and the
estimate from 60-days ago is displayed as a percentage. A larger positive percentage increase will
score better on this component.
Upside
This is the difference between the most accurate estimate, as calculated by Zacks, and the
consensus estimate. For example, a stock with a consensus estimate of $1.00, and a most
accurate estimate of $1.05 will have an upside factor of 5%.
This is not an indication of how much a stock will go up or down. Instead, it's a measure of the
difference between these two estimates. This is particularly useful near earnings season as a
positive upside percentage can be used to help predict a future surprise.
Surprise
The Zacks Rank also factors in the last few quarters of earnings surprises. Companies that have
positively surprised in the recent past have a tendency of positively surprising again in the future (or
missing if they recently missed).
A stock with a recent track record of positive surprises will score better on this factor than a stock
with a history of negative surprises. These stocks will have a greater likelihood of positively
surprising again.
Zacks Style Score Education
The Zacks Style Score is as a complementary indicator to the Zacks Rank, giving investors a way to
focus on the best Zacks Rank stocks that best fit their own stock picking preferences.
Academic research has proven that stocks with the best Growth, Value, and Momentum
characteristics outperform the market. The Zacks Style Scores rate stocks on each of these
individual styles and assigns a rating of A, B, C, D and F. An A, is better than a B; a B is better than
a C; and so on.
Growth Score
Value Score
Momentum Score
As an investor, you want to buy stocks with the highest probability of success. That means buying stocks with a Zacks Rank #1 or #2,
Strong Buy or Buy, which also has a Style Score of an A or a B.
Zacks Equity Research: WBA
www.zacks.com
Page 7 of 8
Disclosures
The analysts contributing to this report do not hold any shares of this stock. The EPS and revenue forecasts are the Zacks
Consensus estimates. Additionally, the analysts contributing to this report certify that the views expressed herein accurately reflect the
analysts' personal views as to the subject securities and issuers. Zacks certifies that no part of the analysts compensation was, is, or
will be, directly or indirectly, related to the specific recommendation or views expressed by the analyst in the report. Additional
information on the securities mentioned in this report is available upon request. This report is based on data obtained from sources we
believe to be reliable, but is not guaranteed as to accuracy and does not purport to be complete. Because of individual objectives, the
report should not be construed as advice designed to meet the particular investment needs of any investor. Any opinions expressed
herein are subject to change. This report is not to be construed as an offer or the solicitation of an offer to buy or sell the securities
herein mentioned. Zacks or its officers, employees or customers may have a position long or short in the securities mentioned and buy
or sell the securities from time to time. Zacks uses the following rating system for the securities it covers which results from a
proprietary quantitative model using trends in earnings estimate revisions. This model is proven most effective for judging the timeliness
of a stock over the next 1 to 3 months. The model assigns each stock a rank from 1 through 5. Zacks Rank 1 = Strong Buy. Zacks Rank
2 = Buy. Zacks Rank 3 = Hold. Zacks Rank 4 = Sell. Zacks Rank 5 = Strong Sell. We also provide a Zacks Industry Rank for each
company which provides an idea of the near-term attractiveness of a company s industry group. We have 264 industry groups in total.
Thus, the Zacks Industry Rank is a number between 1 and 264. In terms of investment attractiveness, the higher the rank the better.
Historically, the top half of the industries has outperformed the general market.
Zacks Equity Research: WBA
www.zacks.com
Page 8 of 8

