Table C. Summary Statistics for Real Estate, Renting and Business
advertisement
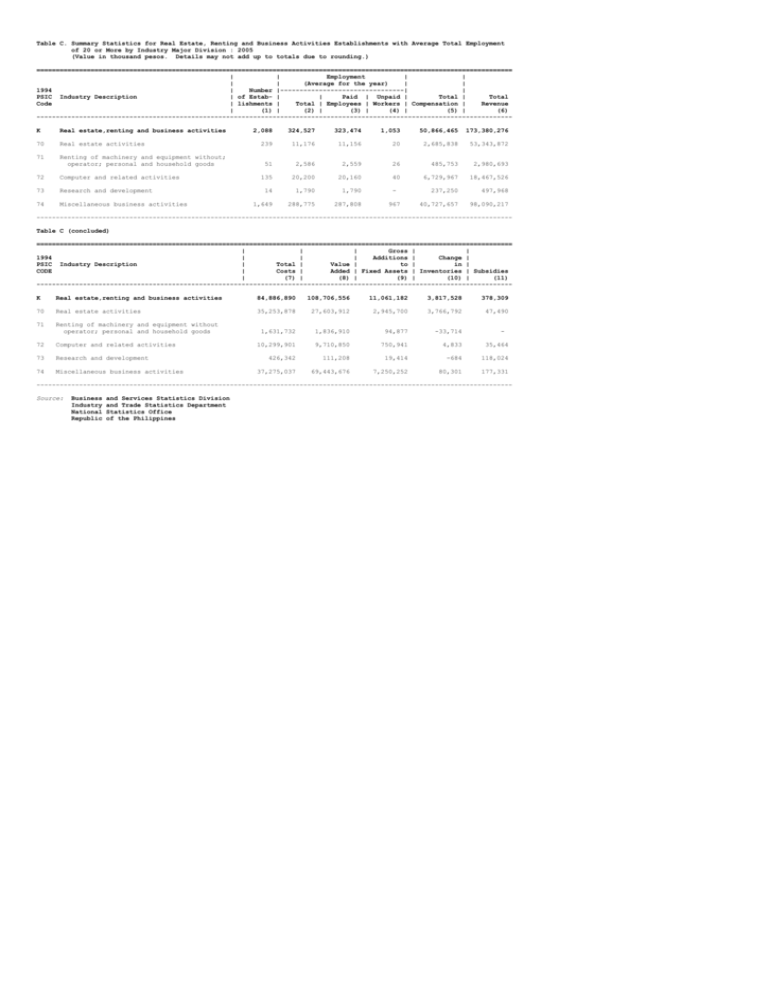
Table C. Summary Statistics for Real Estate, Renting and Business Activities Establishments with Average Total Employment of 20 or More by Industry Major Division : 2005 (Value in thousand pesos. Details may not add up to totals due to rounding.) =========================================================================================================================== | | Employment | | | | (Average for the year) | | 1994 | Number |--------------------------------| | PSIC Industry Description | of Estab- | | Paid | Unpaid | Total | Total Code | lishments | Total | Employees | Workers | Compensation | Revenue | (1) | (2) | (3) | (4) | (5) | (6) --------------------------------------------------------------------------------------------------------------------------K Real estate,renting and business activities 70 Real estate activities 71 Renting of machinery and equipment without; operator; personal and household goods 72 Computer and related activities 73 Research and development 74 Miscellaneous business activities 2,088 324,527 323,474 1,053 50,866,465 173,380,276 239 11,176 11,156 20 2,685,838 53,343,872 51 2,586 2,559 26 485,753 2,980,693 135 20,200 20,160 40 6,729,967 18,467,526 14 1,790 1,790 237,250 497,968 1,649 288,775 287,808 40,727,657 98,090,217 967 --------------------------------------------------------------------------------------------------------------------------Table C (concluded) =========================================================================================================================== | | | Gross | | 1994 | | | Additions | Change | PSIC Industry Description | Total | Value | to | in | CODE | Costs | Added | Fixed Assets | Inventories | Subsidies | (7) | (8) | (9) | (10) | (11) --------------------------------------------------------------------------------------------------------------------------K Real estate,renting and business activities 84,886,890 108,706,556 11,061,182 3,817,528 378,309 70 Real estate activities 35,253,878 27,603,912 2,945,700 3,766,792 47,490 71 Renting of machinery and equipment without operator; personal and household goods 1,631,732 1,836,910 94,877 -33,714 10,299,901 9,710,850 750,941 4,833 35,464 426,342 111,208 19,414 -684 118,024 37,275,037 69,443,676 7,250,252 80,301 177,331 72 Computer and related activities 73 Research and development 74 Miscellaneous business activities - --------------------------------------------------------------------------------------------------------------------------Source: Business Industry National Republic and Services Statistics Division and Trade Statistics Department Statistics Office of the Philippines
