READING ONLINE FINANCIAL TABLES: Yahoo!
advertisement

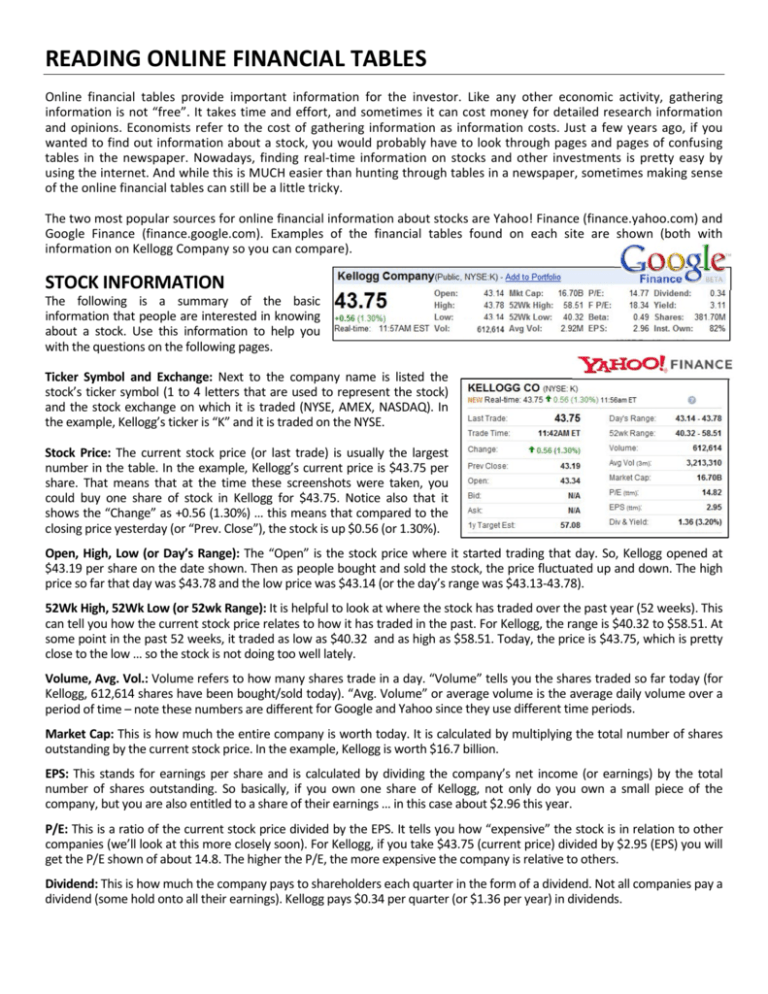
READING ONLINE FINANCIAL TABLES Online financial tables provide important information for the investor. Like any other economic activity, gathering information is not “free”. It takes time and effort, and sometimes it can cost money for detailed research information and opinions. Economists refer to the cost of gathering information as information costs. Just a few years ago, if you wanted to find out information about a stock, you would probably have to look through pages and pages of confusing tables in the newspaper. Nowadays, finding real‐time information on stocks and other investments is pretty easy by using the internet. And while this is MUCH easier than hunting through tables in a newspaper, sometimes making sense of the online financial tables can still be a little tricky. The two most popular sources for online financial information about stocks are Yahoo! Finance (finance.yahoo.com) and Google Finance (finance.google.com). Examples of the financial tables found on each site are shown (both with information on Kellogg Company so you can compare). STOCK INFORMATION The following is a summary of the basic information that people are interested in knowing about a stock. Use this information to help you with the questions on the following pages. Ticker Symbol and Exchange: Next to the company name is listed the stock’s ticker symbol (1 to 4 letters that are used to represent the stock) and the stock exchange on which it is traded (NYSE, AMEX, NASDAQ). In the example, Kellogg’s ticker is “K” and it is traded on the NYSE. Stock Price: The current stock price (or last trade) is usually the largest number in the table. In the example, Kellogg’s current price is $43.75 per share. That means that at the time these screenshots were taken, you could buy one share of stock in Kellogg for $43.75. Notice also that it shows the “Change” as +0.56 (1.30%) … this means that compared to the closing price yesterday (or “Prev. Close”), the stock is up $0.56 (or 1.30%). Open, High, Low (or Day’s Range): The “Open” is the stock price where it started trading that day. So, Kellogg opened at $43.19 per share on the date shown. Then as people bought and sold the stock, the price fluctuated up and down. The high price so far that day was $43.78 and the low price was $43.14 (or the day’s range was $43.13‐43.78). 52Wk High, 52Wk Low (or 52wk Range): It is helpful to look at where the stock has traded over the past year (52 weeks). This can tell you how the current stock price relates to how it has traded in the past. For Kellogg, the range is $40.32 to $58.51. At some point in the past 52 weeks, it traded as low as $40.32 and as high as $58.51. Today, the price is $43.75, which is pretty close to the low … so the stock is not doing too well lately. Volume, Avg. Vol.: Volume refers to how many shares trade in a day. “Volume” tells you the shares traded so far today (for Kellogg, 612,614 shares have been bought/sold today). “Avg. Volume” or average volume is the average daily volume over a period of time – note these numbers are different for Google and Yahoo since they use different time periods. Market Cap: This is how much the entire company is worth today. It is calculated by multiplying the total number of shares outstanding by the current stock price. In the example, Kellogg is worth $16.7 billion. EPS: This stands for earnings per share and is calculated by dividing the company’s net income (or earnings) by the total number of shares outstanding. So basically, if you own one share of Kellogg, not only do you own a small piece of the company, but you are also entitled to a share of their earnings … in this case about $2.96 this year. P/E: This is a ratio of the current stock price divided by the EPS. It tells you how “expensive” the stock is in relation to other companies (we’ll look at this more closely soon). For Kellogg, if you take $43.75 (current price) divided by $2.95 (EPS) you will get the P/E shown of about 14.8. The higher the P/E, the more expensive the company is relative to others. Dividend: This is how much the company pays to shareholders each quarter in the form of a dividend. Not all companies pay a dividend (some hold onto all their earnings). Kellogg pays $0.34 per quarter (or $1.36 per year) in dividends. READING ONLINE FINANCIAL TABLES: Yahoo! Finance (finance.yahoo.com) Use the information below on Dell – which is from Yahoo Finance – to answer the questions below. QUESTIONS (use the table above to answer all of these questions) 1. What stock exchange is Dell traded on? 2. What is the current stock price for Dell in the table? 3. Where did the stock close on the previous day? 4. How has the stock traded over the past year (give me the high and low)? 5. How is the stock performing recently (compare current price with the 52‐week range)? 6. How many shares of Dell have traded on this day? 7. How does this volume compare with an average day of trading? 8. What is the market cap of Dell? What does this mean? 9. Does Dell pay a dividend? If so, how much? 10. What is Dell’s P/E ratio? How is this calculated (what two numbers)? READING ONLINE FINANCIAL TABLES: Google Finance (finance.google.com) Use the information below on Kroger – which is from Google Finance – to answer the questions below. QUESTIONS (use the table above to answer all of these questions) 1. What is Kroger’s ticker symbol? 2. What is the current stock price for Kroger? How much is this up or down from the previous day’s close? 3. If somebody wanted to buy the entire company, how much would they have to pay at the current price? 4. How is the stock performing recently? How can you tell? 5. Does Kroger pay a dividend? If so, how much? 6. What is Kroger’s P/E? If Wal‐Mart’s P/E is 16.1, which one do you think is more “expensive”? What might explain this? 7. How many shares of Kroger trade in an average day? 8. Name two competitors of Kroger (from the “related companies” list above). 9. What is Kroger’s EPS? What does this stand for? How is it calculated? 10. Would you invest in Kroger now? Why or why not?


