FOR INSTITUTIONAL INVESTOR USE ONLY
october 2012
GLOBAL markets
SG GLOBAL Quality Income Index
capital growth | LOW VOLATILITY | INCOME RESILIENCE
SGQI CONCEPT
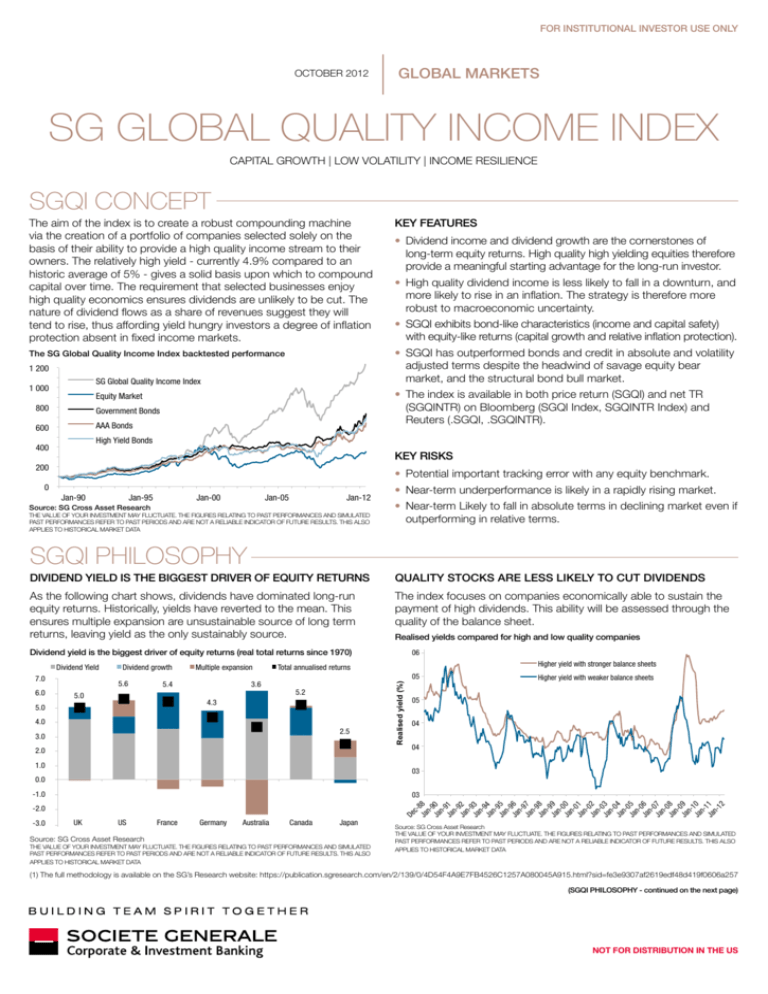
The aim of the index is to create a robust compounding machine
via the creation of a portfolio of companies selected solely on the
basis of their ability to provide a high quality income stream to their
owners. The relatively high yield - currently 4.9% compared to an
historic average of 5% - gives a solid basis upon which to compound
capital over time. The requirement that selected businesses enjoy
high quality economics ensures dividends are unlikely to be cut. The
nature of dividend flows as a share of revenues suggest they will
tend to rise, thus affording yield hungry investors a degree of inflation
protection absent in fixed income markets.
Key features
The SG Global Quality Income Index backtested performance
• SGQI has outperformed bonds and credit in absolute and volatility
adjusted terms despite the headwind of savage equity bear
market, and the structural bond bull market.
1 200
SG Global Quality Income Index
1 000
Government Bonds
600
AAA Bonds
• High quality dividend income is less likely to fall in a downturn, and
more likely to rise in an inflation. The strategy is therefore more
robust to macroeconomic uncertainty.
• SGQI exhibits bond-like characteristics (income and capital safety)
with equity-like returns (capital growth and relative inflation protection).
• The index is available in both price return (SGQI) and net TR
(SGQINTR) on Bloomberg (SGQI Index, SGQINTR Index) and
Reuters (.SGQI, .SGQINTR).
Equity Market
800
• Dividend income and dividend growth are the cornerstones of
long-term equity returns. High quality high yielding equities therefore
provide a meaningful starting advantage for the long-run investor.
High Yield Bonds
400
Key risks
200
• Potential important tracking error with any equity benchmark.
0
Jan-90
Jan-95
Jan-00
Jan-05
Jan-12
Source: SG Cross Asset Research
THE VALUE OF YOUR INVESTMENT MAY FLUCTUATE. THE FIGURES RELATING TO PAST PERFORMANCES AND SIMULATED
PAST PERFORMANCES REFER TO PAST PERIODS AND ARE NOT A RELIABLE INDICATOR OF FUTURE RESULTS. THIS ALSO
APPLIES TO HISTORICAL MARKET DATA
• Near-term underperformance is likely in a rapidly rising market.
• Near-term Likely to fall in absolute terms in declining market even if
outperforming in relative terms.
SGQI PHILOSOPHY
DIVIDEND YIELD IS THE BIGGEST DRIVER OF EQUITY RETURNS
QUALITY STOCKS ARE LESS LIKELY TO CUT DIVIDENDS
As the following chart shows, dividends have dominated long-run
equity returns. Historically, yields have reverted to the mean. This
ensures multiple expansion are unsustainable source of long term
returns, leaving yield as the only sustainably source.
The index focuses on companies economically able to sustain the
payment of high dividends. This ability will be assessed through the
quality of the balance sheet.
Realised yields compared for high and low quality companies
Dividend yield is the biggest driver of equity returns (real total returns since 1970)
7.0
6.0
Dividend growth
5.6
Multiple expansion
5.4
5.0
3.6
5.2
4.0
2.5
3.0
2.0
1.0
Higher yield with weaker balance sheets
05
04
04
03
0.0
-1.0
Ja 88
nJa 90
nJa 91
nJa 92
nJa 93
nJa 94
nJa 95
nJa 96
nJa 97
nJa 98
nJa 99
nJa 00
nJa 01
nJa 02
nJa 03
nJa 04
nJa 05
nJa 06
nJa 07
nJa 08
nJa 09
nJa 10
nJa 11
n12
03
De
c-
-2.0
-3.0
Higher yield with stronger balance sheets
05
4.3
5.0
06
Total annualised returns
Realised yield (%)
Dividend Yield
UK
US
Source: SG Cross Asset Research
France
Germany
Australia
Canada
Japan
THE VALUE OF YOUR INVESTMENT MAY FLUCTUATE. THE FIGURES RELATING TO PAST PERFORMANCES AND SIMULATED
PAST PERFORMANCES REFER TO PAST PERIODS AND ARE NOT A RELIABLE INDICATOR OF FUTURE RESULTS. THIS ALSO
APPLIES TO HISTORICAL MARKET DATA
Source: SG Cross Asset Research
THE VALUE OF YOUR INVESTMENT MAY FLUCTUATE. THE FIGURES RELATING TO PAST PERFORMANCES AND SIMULATED
PAST PERFORMANCES REFER TO PAST PERIODS AND ARE NOT A RELIABLE INDICATOR OF FUTURE RESULTS. THIS ALSO
APPLIES TO HISTORICAL MARKET DATA
(1) The full methodology is available on the SG’s Research website: https://publication.sgresearch.com/en/2/139/0/4D54F4A9E7FB4526C1257A080045A915.html?sid=fe3e9307af2619edf48d419f0606a257
(SGQI PHILOSOPHY - continued on the next page)
NOT FOR DISTRIBUTION IN THE US
FOR INSTITUTIONAL INVESTOR USE ONLY
SGQI PHILOSOPHY - continued from previous page
QUALITY STOCKS ARE SYSTEMATICALLY UNDERVALUED
To the extent that high quality companies are ‘boring’ they are less
bid relative to their intrinsic value. In contrast, higher beta stocks
offer managers excitement and the possibility of game-changing
near-term performance outperformance. They therefore tend to be
over bid relative to their intrinsic value. Emphasising higher quality
businesses is therefore a worthy endeavour in its own right.
High quality stocks are systematically undervalued
800
700
600
QUALITY INCOME
VS. JUNK BONDS
The hunt for yield has seen both high dividend yielding equity and
high yield corporate bonds perform almost in lockstep in recent
years. SG basket of quality income stocks has experienced almost
identical gains to the IBOXX High Yield Corporate Bond Index over
the past few years.
Appearances can be deceptive though. Exposure to future unknown
scenarios differs considerably:
High Quality
• The type of companies backing each index is not comparable. By
design, junk bonds indices contain the lowest quality companies
whereas SGQI seeks exposure to the better quality companies as
a subset of the high yield equity universe.
Low Quality Equities
500
400
200
• The absence of coupon growth exposes fixed income investors
to inflation risk, whilst for equity investors dividends typically track
inflation higher.
100
SGQI Index versus the IBOXX High Yield Corporate Bond Index
300
170
De
c8
Ja 9
n91
Ja
n9
Ja 2
n9
Ja 3
n9
Ja 4
n9
Ja 5
n96
Ja
n9
Ja 7
n98
Ja
n9
Ja 9
n00
Ja
n0
Ja 1
n02
Ja
n0
Ja 3
n04
Ja
n0
Ja 5
n06
Ja
n0
Ja 7
n08
Ja
n0
Ja 9
n10
Ja
n1
Ja 1
n12
0
SG Global Quality Income Index
Source: SG Cross Asset Research
THE VALUE OF YOUR INVESTMENT MAY FLUCTUATE. THE FIGURES RELATING TO PAST PERFORMANCES AND SIMULATED
PAST PERFORMANCES REFER TO PAST PERIODS AND ARE NOT A RELIABLE INDICATOR OF FUTURE RESULTS. THIS ALSO
APPLIES TO HISTORICAL MARKET DATA
Total
150
130
110
THE POWERFUL COMBINATION OF QUALITY AND INCOME
It is important to emphasise how powerful a role quality plays in
the selection of robust income: quality income isn’t just an income
strategy. The following chart compares SGQI’s total returns with a
similarly constructed “high yield equities index” (consisting purely
of high income stocks without regard to quality), a “quality index”
(consisting purely of quality stocks regardless of their yield) and the
overall market index. Note the following:
• Both quality stocks and high yield stocks have outperformed the
market.
• Quality Income as represented by the SGQI has outperformed
them both.
• Despite the bull market in bonds, SGQI has outperformed risk
income (even adjusting for volatility).
1 200
1 000
SG Global Quality Income Index
Quality Equities
High Yield Equities
Equity Market
Government Bonds
AAA Bonds
Aug-09
Jul-10
Jan-11
jul-12
Jan-12
Jul-12
Source: SG Cross Asset Research, Bloomberg
THE VALUE OF YOUR INVESTMENT MAY FLUCTUATE. THE FIGURES RELATING TO PAST PERFORMANCES AND
SIMULATED PAST PERFORMANCES REFER TO PAST PERIODS AND ARE NOT A RELIABLE INDICATOR OF FUTURE
RESULTS. THIS ALSO APPLIES TO HISTORICAL MARKET DATA
Dividend growth and long run inflation
12%
10%
8%
6%
4%
2%
0%
-2%
-4%
-6%
-8%
Annualised 10y dividend growth
Annualised 10y CPI growth
Asset backing compared: Credit ratings of SGQI vs IBOXX HY constituents
600
25%
400
% of portfolio
20%
200
0
Jan-10
Source: SG Cross Asset Research, Bloomberg
THE VALUE OF YOUR INVESTMENT MAY FLUCTUATE. THE FIGURES RELATING TO PAST PERFORMANCES AND SIMULATED
PAST PERFORMANCES REFER TO PAST PERIODS AND ARE NOT A RELIABLE INDICATOR OF FUTURE RESULTS. THIS ALSO
APPLIES TO HISTORICAL MARKET DATA
High Yield Bonds
800
90
18
8
18 1
8
18 4
87
18
9
18 1
9
18 4
98
19
0
19 1
0
19 4
08
19
1
19 1
1
19 5
18
19
2
19 2
2
19 5
2
19 8
3
19 2
3
19 5
39
19
42
19
4
19 5
4
19 9
5
19 2
5
19 6
5
19 9
6
19 3
6
19 6
6
19 9
7
19 3
76
19
8
19 0
8
19 3
8
19 6
9
19 0
93
19
9
20 7
0
20 0
0
20 4
0
20 7
10
SG Global Quality Income Index performance (total return in Euros )
IBOXX High Yield Corporate Bonds Index
Jan-91
Jan-95
Jan-00
Jan-05
Jan-12
SG Global Quality Income Index
iShares IBOXX High Yield
15%
10%
5%
Source: SG Cross Asset Research, Bloomberg
THE VALUE OF YOUR INVESTMENT MAY FLUCTUATE. THE FIGURES RELATING TO PAST PERFORMANCES AND
SIMULATED PAST PERFORMANCES REFER TO PAST PERIODS AND ARE NOT A RELIABLE INDICATOR OF FUTURE
RESULTS. THIS ALSO APPLIES TO HISTORICAL MARKET DATA
0%
Source: SG Cross Asset Research, Bloomberg
THE VALUE OF YOUR INVESTMENT MAY FLUCTUATE. THE FIGURES RELATING TO PAST PERFORMANCES AND SIMULATED
PAST PERFORMANCES REFER TO PAST PERIODS AND ARE NOT A RELIABLE INDICATOR OF FUTURE RESULTS. THIS ALSO
APPLIES TO HISTORICAL MARKET DATA
SG Global Quality Income Index
2
NOT FOR DISTRIBUTION IN THE US
FOR INSTITUTIONAL INVESTOR USE ONLY
SGQI METHODOLOGY(1)
• THE INDEX COMPRISES BETWEEN 25 AND 75 STOCKS OF THE UNIVERSE, WHICH GATHERS STOCKS THAT:
• are listed on a regulated market of an Eligible Country
• are not financial companies (our methodology isn’t able to assess financial sector balance sheet risks)
• have a free float adjusted market capitalization of at least US$ 3bn
THREE STEP SELECTION PROCESS:
1]SELECTION OF THE STOCKS WITH A
QUALITY SCORE HIGHER THAN 7
Piotroski’s 9 quality factors are considered:
Profitability factors
• Positive ROA (calculated as net income before extraordinary items
divided by total assets)
• Positive CFO (cashflow from operations divided by total assets)
• Improving profitability (positive year on year change of ROA)
• Sales driving profit growth (change in CFO greater than the change
in ROA)
2] S
ELECTION OF THE 40% BEST SCORED
STOCKS WITH RESPECT TO BALANCE
SHEET
This score is measured through a distance to default model that looks
at the equity of the firm as a contingent claim on the firm’s capital
structure. It assumes that the corporation is financed through a single
debt instrument and a single equity issue. At the maturity of the bond,
the firm liquidates its assets and cease to exist. Bondholders receive
back the face value of the bond while shareholders receive any residual
payment (and nothing in the case where the firm is not capable of
paying off its creditors). The Distance to Default is calculated as:
Distance to default =
Leverage, liquidity and source of funds
• Decreasing leverage (negative year on year change of the ratio of
long-term debt to total assets)
• Increasing liquidity (positive year on year change of the ratio of
current assets to current liabilities)
• No issue of equity (no year on year increase of shares)
Operating efficiency
• Increase in operating margin (positive year on year change in the
gross operating margin)
• Increasing turn over (increase of sales relative to the size of the asset
base, which means generating more business from existing assets)
Assets value — Default point
Assets value x Asset Volatility
Where, Default Point (F) is the book value of current liabilities plus half
the long term liabilities.
3] S
ELECTION OF STOCKS WITH HIGH
DIVIDEND YIELD
The trigger is an adjusted dividend yield greater than highest value of
either 4% or 125% of the market cap-weighted dividend yield of the
universe in the event that all market yields rise. Where available, the
one year forward dividend yield based on IBES consensus forecast
is used. Where unavailable the reported dividend sourced from
Factset fundamentals are used.
(1) The full methodology is available on the SG’s Research website: https://publication.sgresearch.com/en/2/139/0/4D54F4A9E7FB4526C1257A080045A915.html?sid=fe3e9307af2619edf48d419f0606a257
SG Global Quality Income Index
3
NOT FOR DISTRIBUTION IN THE US
FOR INSTITUTIONAL INVESTOR USE ONLY
IMPORTANT DISCLAIMER:
This note was prepared by the GEF Engineering and Strategy Team of Societe Generale.
This communication is exclusively directed and available to Institutional Investors as defined by the 2004/39/CE Directive on markets in financial instruments acting for their own account and categorized as
eligible counterparties or professional clients.
This publication includes investment recommendations issued from Société Générale’s investment Research department which has set, in accordance with applicable regulation, effective administrative and
organizational arrangements, including information barriers to prevent and avoid conflicts of interest with respect to the investment recommendations contained in this publication.
Research publications supporting this document were issued on their stated publication date and may have already been acted upon by clients of Société Générale.
Without prejudice to its legal or regulatory obligations, Societe Generale may not be held responsible for any financial or other consequences that may arise from investing in a product having as its underlying
the index described herein (the “Index”), and investors are responsible, prior to making any investment in a product having the Index as its underlying, for making their own appraisal and, if they deem it
necessary, to seek and obtain professional advice on the risks and merits of the product.
This document does not constitute an offer, a solicitation, an advice or a recommendation from Societe Generale to purchase or sell the Index, which cannot be invested in directly. The purpose of this
document is simply to describe the principles and main financial characteristics of the Index.
The level of the Index may be subject to signifi cant volatility due to, inter alia, the evolution of the price of the underlying instrument(s) and of the interest rates.
A product having the Index as underlying may be subject to restrictions with regard to certain persons or in certain countries under national regulations applicable to such persons or in said countries. It is
each investor’s responsibility to ascertain that it is authorised to conclude, or invest into, this product. By undertaking such an investment, each investor is deemed to certify to Societe Generale that it is duly
authorised to do so.
The Index is the sole and exclusive property of Societe Generale.
Societe Generale does not guarantee the accuracy and/or the completeness of the composition, calculation, dissemination and adjustment of the Index, nor of the data included therein.
Societe Generale shall have no liability for any errors, omissions, interruptions or delays relating to the Index.
Societe Generale makes no warranty, whether express or implied, relating to (i) the merchantability or fitness for a particular purpose of the Index, and (ii) the results of the use of the Index or any data included
therein.
Societe Generale shall have no liability for any losses, damages, costs or expenses (including loss of profits) arising, directly or indirectly, from the use of the Index or any data included therein.
The levels of the Index do not represent a valuation or a price for any product referencing such Index. The Index rules (the “Index Rules”) define the calculation principles of the Index and the consequences
on this Index of extraordinary events which may affect one or several of the underlying programmes on which it is based.
This document is of a commercial and not of a regulatory nature.
The accuracy, completeness or relevance of the information which has been drawn from external sources is not guaranteed although it is drawn from sources believed to be reliable. Societe Generale shall
not assume any liability in this respect.
The market information presented in this document is based on data at a given moment and may change from time to time. The potential performance may increase or decrease as a result of currency
fluctuations.
The roles of the different teams involved within Societe Generale in the design, maintenance and replication of the Index have been strictly defi ned. Where Societe Generale holds the product and other
positions exposing it to the Index for its own account, the replication of the Index is made in the same manner by a single team within Societe Generale, be it for the purpose of hedging the product held by
external investors or for the purpose of the positions held by Societe Generale acting for its own account. Societe Generale may take positions in the market of the financial instruments or of other assets
involved in the composition of the Index, including as liquidity provider.
Structured Solutions AG is the Calculation Agent of the Index. The iBoxx index referred to here is the property of Markit Indices Limited (“the index sponsor”).
This document is confidential and may be neither communicated to any third party (with the exception of external advisors on the condition that they themselves respect this confidentiality undertaking) nor
copied in whole or in part, without the prior written consent of Societe Generale.
Societe Generale is authorised and regulated by the Autorité de Contrôle Prudentiel and the Autorité des Marchés Financiers, and subject to limited regulation by the Financial Services Authority for the conduct
of its UK business. Details about the extent of our regulation by the Financial Services Authority are available from us on request.
712989(A) - Réalisation Studio Société Générale - 09/2012
IMPORTANT DISCLOSURES: Please refer to our websites http://www.sgcib.com/
Copyright: Societe Generale 2012. All rights reserved.
NOT FOR DISTRIBUTION IN THE US


