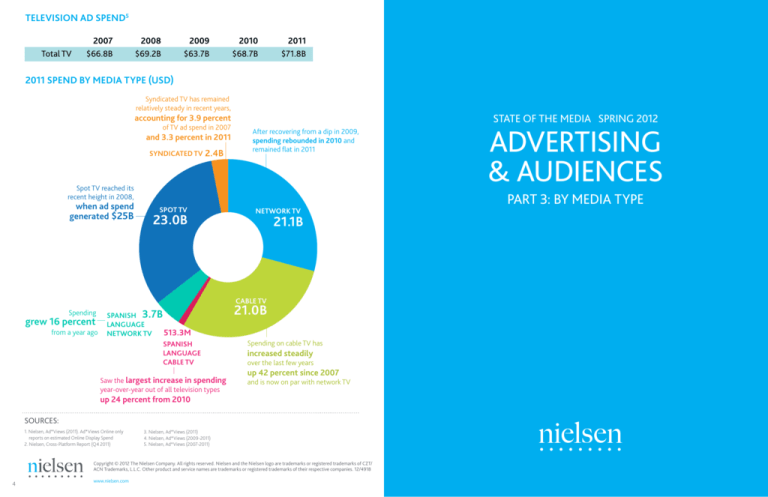
Television Ad Spend5
Total TV
2007
$66.8B
2008
$69.2B
2009
$63.7B
2010
$68.7B
2011
$71.8B
2011 Spend by Media Type (USD)
Syndicated TV has remained
relatively steady in recent years,
STATE OF THE MEDIA Spring 2012
accounting for 3.9 percent
of TV ad spend in 2007
and 3.3 percent in 2011
SYNDICATED TV 2.4B
After recovering from a dip in 2009,
spending rebounded in 2010 and
remained flat in 2011
Spot TV reached its
recent height in 2008,
when ad spend
generated $25B
SPOT TV
23.0B
NETWORK TV
Advertising
& Audiences
Part 3: BY MEDIA TYPE
21.1B
CABLE TV
Spending
grew 16 percent
from a year ago
SPANISH 3.7B
LANGUAGE
513.3M
NETWORK TV
SPANISH
LANGUAGE
CABLE TV
Saw the largest increase in spending
year-over-year out of all television types
21.0B
Spending on cable TV has
increased steadily
over the last few years
up 42 percent since 2007
and is now on par with network TV
up 24 percent from 2010
SOURCES:
1. Nielsen, Ad*Views (2011). Ad*Views Online only
reports on estimated Online Display Spend
2. Nielsen, Cross-Platform Report (Q4 2011)
3. Nielsen, Ad*Views (2011)
4. Nielsen, Ad*Views (2009-2011)
5. Nielsen, Ad*Views (2007-2011)
Copyright © 2012 The Nielsen Company. All rights reserved. Nielsen and the Nielsen logo are trademarks or registered trademarks of CZT/
ACN Trademarks, L.L.C. Other product and service names are trademarks or registered trademarks of their respective companies. 12/4918
4
www.nielsen.com
1
AN IN-DEPTH LOOK AT AUDIENCES
AND ADVERTISING
Overall, the amount of national TV ad units
rose 14% from 2010 to 2011
BY MEDIA TYPE
2011 AD SPEND BY MEDIA TYPE (USD)1
Monthly Time Spent in Hours: Minutes
0:00 YOY
4:20
+35.7% YOY
Mobile Subscribers Watching
Video on a Mobile Phone
33.5M
+0:11 YOY
4:34
+4.2% YOY
Watching Video on Internet
147.4M
+0:18 YOY
26:10
+7.1% YOY
113.5M
12B
Internet
Newspapers
Watching Timeshifted TV
6B
(only in homes with DVRs)
Television
Magazines
-0:46 YOY
Radio
153:19
72B
-0.5%
NETWORK TV
Monthly time spent Q4 11
16B
7B
In the U.S., ad spending increased 2 percent from 2010.
TOP CATEGORIES BY SPEND3
All Media
Direct Response
Restaurant
All English and Spanish Language TV
TV COMMERCIAL LENGTH4
Share of All Commercial Units
Dish Network
$10.2B
$1.9B
TOP BRANDS*
Allstate
$1.9B $1.7B
Automotive
Department Store $3.4B
2009
$265.9M $239.5M
$1.1B
$278.1M
Home Depot
2011
:15
:15
33%
33%
34%
:30
46%
48%
47%
:60
10%
9%
9%
AT&T
$283.2M
2010
Comcast
Motion Picture $3.5B
The average length of a TV
commercial in 2011
CABLE TV
Overall usage Q4 11
Auto Insurance
28.4s
Monthly Audience Reach (P2+)
-1.7% YOY
Television ad spend in 2011 was
up 4.5 percent from 2010, with
spending on Spanish-language cable
and network TV seeing double
digit growth (up 24% and 16%,
respectively). Though print makes
up a significant share of annual ad
spend--accounting for 25 percent-more is spent on TV than all other
platforms combined.
+5.4%
CROSS-PLATFORM VIDEO VIEWING2
On Traditional TV
284.4M
American advertisers and
consumers’ appetite for television
is apparent, as TV holds the lion’s
share of ad dollars and consumers’
media time. The third and final part
of Nielsen’s look at audiences and
advertising offers an in-depth look
at media by platform.
YOY % CHANGE
IN AD SPEND
$4.2B
Quick Service
Restaurants
Automotive Dealership $3.5B
$3.9B
Pharmaceutical
$3.6B
Telephone Services / Wireless
$315.6M
$702.2M
Walmart
Verizon Wireless
$326.3M
DIRECTV
$335.7M
State Farm
$414.8M
Geico
Read as: In 2011, $10.2 billion was spent on Automotive advertising
* AT&T Wireless Web Access, Verizon Wireless Web Access, Geico Auto Insurance, State Farm Auto Insurance, DIRECTV Satellite Services, Wal-Mart Dept Store,
Comcast Xfinity, Home Depot Home Improvement, Dish Network Satellite Services, Allstate Auto Insurance
Source: Nielsen
2
Copyright © 2012 The Nielsen Company.
3

