Financial Highlights
advertisement
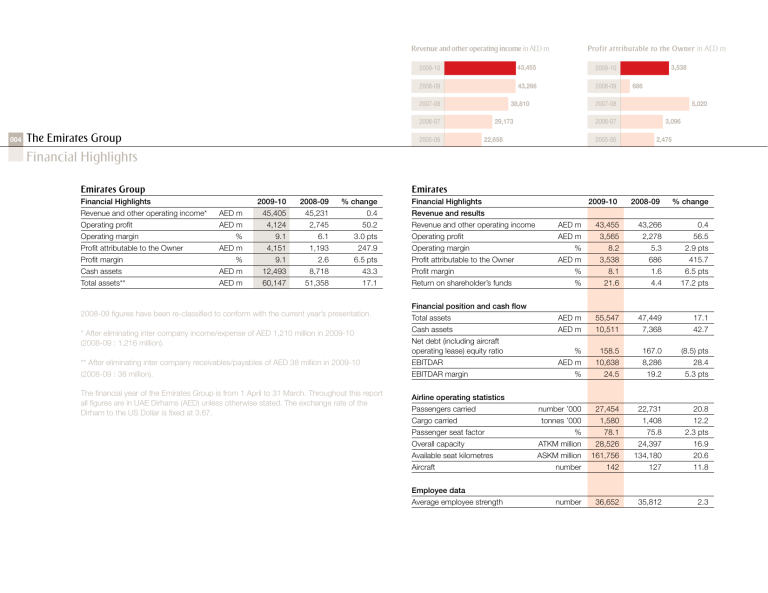
Revenue and other operating income in AED m 2009-10 43,455 2009-10 2008-09 43,266 2008-09 38,810 2007-08 2006-07 004 The Emirates Group Profit attributable to the Owner in AED m 2005-06 29,173 22,658 3,538 686 5,020 2007-08 3,096 2006-07 2005-06 2,475 Financial Highlights Emirates Group Financial Highlights Revenue and other operating income* AED m Operating profit AED m Operating margin % Profit attributable to the Owner AED m Profit margin % Cash assets AED m Total assets** AED m 2009-10 45,405 4,124 9.1 4,151 9.1 12,493 60,147 2008-09 45,231 2,745 6.1 1,193 2.6 8,718 51,358 Emirates % change 0.4 50.2 3.0 pts 247.9 6.5 pts 43.3 17.1 2008-09 figures have been re-classified to conform with the current year’s presentation. * After eliminating inter company income/expense of AED 1,210 million in 2009-10 (2008-09 : 1,216 million). ** After eliminating inter company receivables/payables of AED 38 million in 2009-10 (2008-09 : 38 million). The financial year of the Emirates Group is from 1 April to 31 March. Throughout this report all figures are in UAE Dirhams (AED) unless otherwise stated. The exchange rate of the Dirham to the US Dollar is fixed at 3.67. Financial Highlights 2009-10 2008-09 % change Revenue and results Revenue and other operating income AED m 43,455 43,266 0.4 Operating profit AED m 3,565 2,278 56.5 Operating margin % 8.2 5.3 2.9 pts Profit attributable to the Owner AED m 3,538 686 415.7 Profit margin % 8.1 1.6 6.5 pts Return on shareholder’s funds % 21.6 4.4 17.2 pts Financial position and cash flow Total assets AED m 55,547 47,449 17.1 Cash assets AED m 10,511 7,368 42.7 Net debt (including aircraft operating lease) equity ratio % 158.5 167.0 (8.5) pts EBITDAR AED m 10,638 8,286 28.4 EBITDAR margin % 24.5 19.2 5.3 pts Airline operating statistics Passengers carried number ’000 27,454 22,731 20.8 Cargo carried tonnes ’000 1,580 1,408 12.2 Passenger seat factor % 78.1 75.8 2.3 pts Overall capacity ATKM million 28,526 24,397 16.9 Available seat kilometres ASKM million 161,756 134,180 20.6 Aircraft number 142 127 11.8 Employee data Average employee strength number 36,652 35,812 2.3 Revenue and other operating income in AED m Profit attributable to the Owner in AED m 2009-10 3,160 2009-10 2008-09 3,181 2008-09 2,585 2007-08 2006-07 2005-06 1,996 1,734 2007-08 2006-07 2005-06 613 507 305 360 324 Dnata Financial Highlights 2009-10 2008-09 Revenue and results Revenue and other operating income AED m 3,160 3,181 Operating profit AED m 559 467 Operating margin % 17.7 14.7 Profit attributable to the Owner AED m 613 507 Profit margin % 19.4 15.9 Return on shareholder’s funds % 21.3 21.4 Financial position Total assets AED m 4,638 3,947 Cash assets AED m 1,982 1,350 Airport operating statistics Aircraft handled number 192,120 177,495 Cargo handled tonnes ’000 1,121 1,003 Employee data Average employee strength number 13,298 12,434 % change (0.7) 19.7 3.0 pts 20.9 3.5 pts (0.1) pts 17.5 46.8 8.2 11.8 6.9

