Invasive Species Lab
advertisement
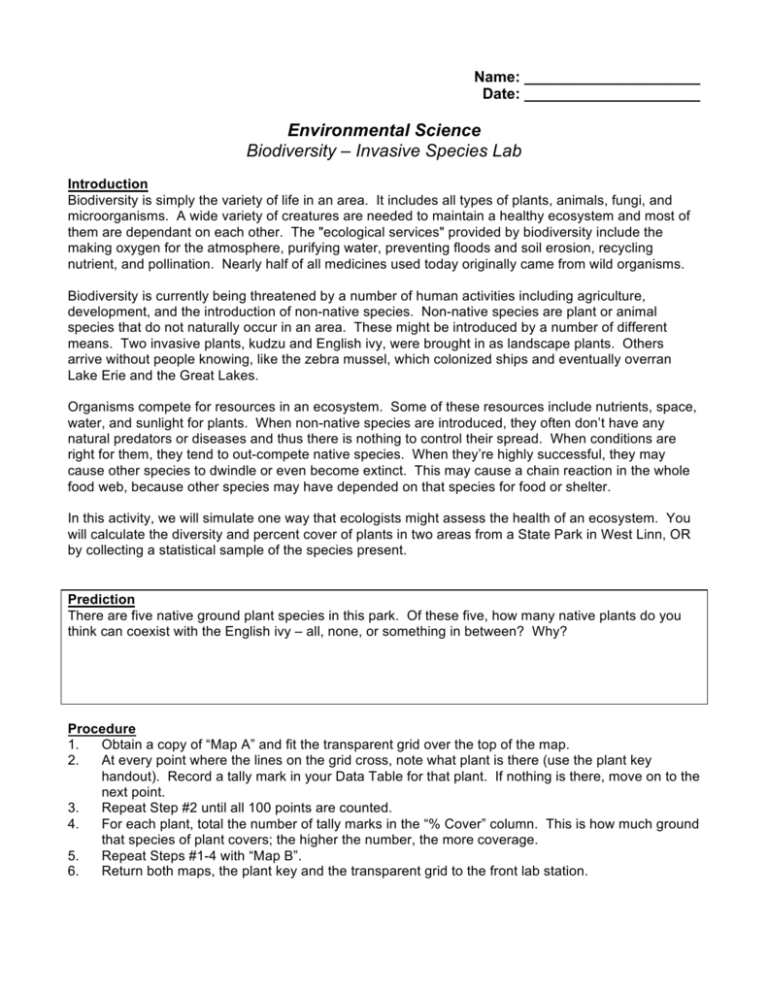
Name: _____________________ Date: _____________________ Environmental Science Biodiversity – Invasive Species Lab Introduction Biodiversity is simply the variety of life in an area. It includes all types of plants, animals, fungi, and microorganisms. A wide variety of creatures are needed to maintain a healthy ecosystem and most of them are dependant on each other. The "ecological services" provided by biodiversity include the making oxygen for the atmosphere, purifying water, preventing floods and soil erosion, recycling nutrient, and pollination. Nearly half of all medicines used today originally came from wild organisms. Biodiversity is currently being threatened by a number of human activities including agriculture, development, and the introduction of non-native species. Non-native species are plant or animal species that do not naturally occur in an area. These might be introduced by a number of different means. Two invasive plants, kudzu and English ivy, were brought in as landscape plants. Others arrive without people knowing, like the zebra mussel, which colonized ships and eventually overran Lake Erie and the Great Lakes. Organisms compete for resources in an ecosystem. Some of these resources include nutrients, space, water, and sunlight for plants. When non-native species are introduced, they often don’t have any natural predators or diseases and thus there is nothing to control their spread. When conditions are right for them, they tend to out-compete native species. When they’re highly successful, they may cause other species to dwindle or even become extinct. This may cause a chain reaction in the whole food web, because other species may have depended on that species for food or shelter. In this activity, we will simulate one way that ecologists might assess the health of an ecosystem. You will calculate the diversity and percent cover of plants in two areas from a State Park in West Linn, OR by collecting a statistical sample of the species present. Prediction There are five native ground plant species in this park. Of these five, how many native plants do you think can coexist with the English ivy – all, none, or something in between? Why? Procedure 1. Obtain a copy of “Map A” and fit the transparent grid over the top of the map. 2. At every point where the lines on the grid cross, note what plant is there (use the plant key handout). Record a tally mark in your Data Table for that plant. If nothing is there, move on to the next point. 3. Repeat Step #2 until all 100 points are counted. 4. For each plant, total the number of tally marks in the “% Cover” column. This is how much ground that species of plant covers; the higher the number, the more coverage. 5. Repeat Steps #1-4 with “Map B”. 6. Return both maps, the plant key and the transparent grid to the front lab station. Data Table Species Map A Tally % Cover Map B Tally % Cover Bracken fern Clematis Ducksfoot English ivy Trailing raspberry Vine maple Questions 1. How did the percent cover in Map A compare with the percent cover in Map B? Were they similar or different? How? 2. Why do you think experts call areas like the Map B an “ivy desert”? 3. Ivy is successfully competing for resources in the ecosystem shown in Map B. What resource or resources does “percent cover” represent? 4. If the ivy in Map B is allowed to continue growing, what are two possible impacts that could affect the rest of the species (including plants and animals) in this ecosystem? 5. What are two things that can be done to recreate the natural biodiversity of this area? 6. Why do you think scientists use this “statistical sampling” grid method instead of counting every plant in an area?
