High tensile ductility in a nanostructured metal
advertisement
letters to nature
..............................................................
High tensile ductility in a
nanostructured metal
Yinmin Wang*, Mingwei Chen†, Fenghua Zhou† & En Ma*
* Department of Materials Science and Engineering,
† Department of Mechanical Engineering, The Johns Hopkins University,
Baltimore, Maryland 21218, USA
.............................................................................................................................................................................
Nanocrystalline metals—with grain sizes of less than 100 nm—
have strengths exceeding those of coarse-grained and even
alloyed metals1,2, and are thus expected to have many applications. For example, pure nanocrystalline Cu (refs 1–7) has a
yield strength in excess of 400 MPa, which is six times higher than
that of coarse-grained Cu. But nanocrystalline materials often
exhibit low tensile ductility at room temperature, which limits
their practical utility. The elongation to failure is typically less
than a few per cent; the regime of uniform deformation is even
smaller1–7. Here we describe a thermomechanical treatment of Cu
that results in a bimodal grain size distribution, with micrometre-sized grains embedded inside a matrix of nanocrystalline
and ultrafine (<300 nm) grains. The matrix grains impart high
strength, as expected from an extrapolation of the Hall–Petch
relationship. Meanwhile, the inhomogeneous microstructure
induces strain hardening mechanisms8–11 that stabilize the tensile
deformation, leading to a high tensile ductility—65% elongation
to failure, and 30% uniform elongation. We expect that these
results will have implications in the development of tough
nanostructured metals for forming operations and highperformance structural applications including microelectromechanical and biomedical systems.
The pure copper used in this model study is very ductile in its
annealed and coarse-grained form. It has an elongation to failure as
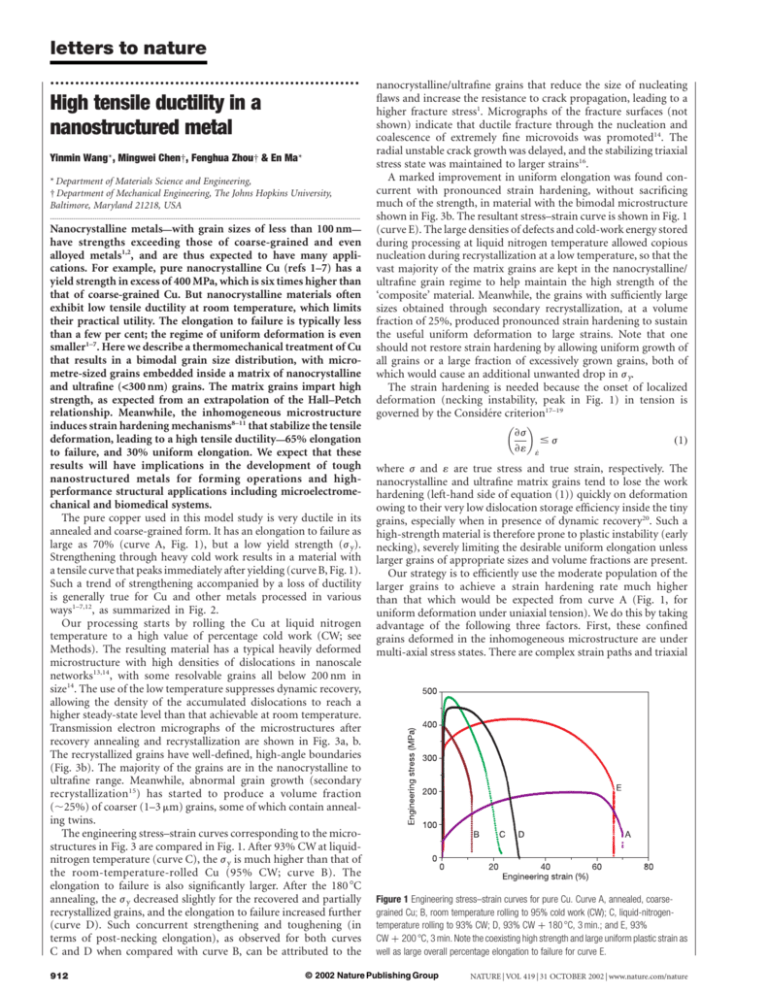
large as 70% (curve A, Fig. 1), but a low yield strength (j y).
Strengthening through heavy cold work results in a material with
a tensile curve that peaks immediately after yielding (curve B, Fig. 1).
Such a trend of strengthening accompanied by a loss of ductility
is generally true for Cu and other metals processed in various
ways1–7,12, as summarized in Fig. 2.
Our processing starts by rolling the Cu at liquid nitrogen
temperature to a high value of percentage cold work (CW; see
Methods). The resulting material has a typical heavily deformed
microstructure with high densities of dislocations in nanoscale
networks13,14, with some resolvable grains all below 200 nm in
size14. The use of the low temperature suppresses dynamic recovery,
allowing the density of the accumulated dislocations to reach a
higher steady-state level than that achievable at room temperature.
Transmission electron micrographs of the microstructures after
recovery annealing and recrystallization are shown in Fig. 3a, b.
The recrystallized grains have well-defined, high-angle boundaries
(Fig. 3b). The majority of the grains are in the nanocrystalline to
ultrafine range. Meanwhile, abnormal grain growth (secondary
recrystallization15) has started to produce a volume fraction
(,25%) of coarser (1–3 mm) grains, some of which contain annealing twins.
The engineering stress–strain curves corresponding to the microstructures in Fig. 3 are compared in Fig. 1. After 93% CW at liquidnitrogen temperature (curve C), the j y is much higher than that of
the room-temperature-rolled Cu (95% CW; curve B). The
elongation to failure is also significantly larger. After the 180 8C
annealing, the j y decreased slightly for the recovered and partially
recrystallized grains, and the elongation to failure increased further
(curve D). Such concurrent strengthening and toughening (in
terms of post-necking elongation), as observed for both curves
C and D when compared with curve B, can be attributed to the
912
nanocrystalline/ultrafine grains that reduce the size of nucleating
flaws and increase the resistance to crack propagation, leading to a
higher fracture stress1. Micrographs of the fracture surfaces (not
shown) indicate that ductile fracture through the nucleation and
coalescence of extremely fine microvoids was promoted14. The
radial unstable crack growth was delayed, and the stabilizing triaxial
stress state was maintained to larger strains16.
A marked improvement in uniform elongation was found concurrent with pronounced strain hardening, without sacrificing
much of the strength, in material with the bimodal microstructure
shown in Fig. 3b. The resultant stress–strain curve is shown in Fig. 1
(curve E). The large densities of defects and cold-work energy stored
during processing at liquid nitrogen temperature allowed copious
nucleation during recrystallization at a low temperature, so that the
vast majority of the matrix grains are kept in the nanocrystalline/
ultrafine grain regime to help maintain the high strength of the
‘composite’ material. Meanwhile, the grains with sufficiently large
sizes obtained through secondary recrystallization, at a volume
fraction of 25%, produced pronounced strain hardening to sustain
the useful uniform deformation to large strains. Note that one
should not restore strain hardening by allowing uniform growth of
all grains or a large fraction of excessively grown grains, both of
which would cause an additional unwanted drop in j y.
The strain hardening is needed because the onset of localized
deformation (necking instability, peak in Fig. 1) in tension is
governed by the Considére criterion17–19
›j
#j
ð1Þ
›1 1_
where j and 1 are true stress and true strain, respectively. The
nanocrystalline and ultrafine matrix grains tend to lose the work
hardening (left-hand side of equation (1)) quickly on deformation
owing to their very low dislocation storage efficiency inside the tiny
grains, especially when in presence of dynamic recovery20. Such a
high-strength material is therefore prone to plastic instability (early
necking), severely limiting the desirable uniform elongation unless
larger grains of appropriate sizes and volume fractions are present.
Our strategy is to efficiently use the moderate population of the
larger grains to achieve a strain hardening rate much higher
than that which would be expected from curve A (Fig. 1, for
uniform deformation under uniaxial tension). We do this by taking
advantage of the following three factors. First, these confined
grains deformed in the inhomogeneous microstructure are under
multi-axial stress states. There are complex strain paths and triaxial
Figure 1 Engineering stress–strain curves for pure Cu. Curve A, annealed, coarsegrained Cu; B, room temperature rolling to 95% cold work (CW); C, liquid-nitrogentemperature rolling to 93% CW; D, 93% CW þ 180 8C, 3 min.; and E, 93%
CW þ 200 8C, 3 min. Note the coexisting high strength and large uniform plastic strain as
well as large overall percentage elongation to failure for curve E.
© 2002 Nature Publishing Group
NATURE | VOL 419 | 31 OCTOBER 2002 | www.nature.com/nature
letters to nature
strain components, with very large strain gradients (see Supplementary Information). It is known that a complex stress state, complicated straining patterns and dislocation configurations, and high
densities of geometrically necessary dislocations are all beneficial for
promoting grain refinement (or dislocation storage and strain
hardening). For example, equal channel angular pressing (ECAP)
uses similar conditions to make nanostructured metals in an
efficient way21. For a metal such as Cu, the non-uniform deformation over a length scale of the order of a few micrometres (Fig. 3b)
is the realm of strain-gradient plasticity theory11, which predicts
significant strain hardening owing to an excessively large number of
geometrically necessary dislocations that are forced to be present to
accommodate the large strain gradient.
Second, k112l {111̄} twinning, as shown in Fig. 4a and the
selected-area electron diffraction pattern in the upper left inset,
was observed unexpectedly after straining for 6% inside most of
these larger grains. Deformation twins have not been observed for
Cu before except at high strain rates or low, sub-ambient temperatures, and activation of such twins is known to require high stresses,
especially when the grain sizes are small8,9,22,23. Additional observations by transmission electron microscopy (for example, the
high-resolution image in Fig. 4a lower right inset) show twin
boundaries located preferentially near the protrusions of the surrounding nanocrystalline/ultrafine grains into the softer large
grains, suggesting twinning initiation presumably due to stress
concentration. The activation of the twinning mechanism suggests
that these constrained larger grains plastically deform at high
stresses, consistent with the high strength observed. In terms of
enhancing strain hardening, twinning is known to be highly
effective in conventional Cu (refs 8, 9), owing to dislocation pileups
at the twin boundaries (Fig. 4a). In nanocrystalline Cu, the interfaces generated between twinned segments can act as strong barriers
to dislocation motion10.
Third, the larger (softer) grains accommodate strains preferentially (see Supplementary Information). When the overall uniform
elongation reached ,30% (peak of curve E in Fig. 1), these larger
grains had accumulated large numbers of twin boundaries, dislocations and subgrain boundaries such that the microstructure was
refined to a level similar to the nanocrystalline/ultrafine grained
matrix, Fig. 4b). Afterwards, the post-necking elongation is similar
Figure 2 Representative tensile properties of pure Cu. The data are for Cu of conventional,
ultrafine and nanocrystalline grain sizes4–7,12, and after cold rolling to various degrees of
CW from our own tests (filled black circles). Data points E, A and B are from the
corresponding curves in Fig. 1. Uniform elongation up to the peak in the engineering
stress–strain curve is compared here, not only because it is a desirable property but also
because the overall percentage elongation to failure is often dominated by localized
deformation (necking) whose magnitude depends on the gauge length used in the
different experiments. The ‘tough Cu’ developed here (E) is clearly separated from the
general trend.
NATURE | VOL 419 | 31 OCTOBER 2002 | www.nature.com/nature
to that discussed for the sample annealed at 180 8C (curve D in
Fig. 1). Overall, the nanostructured Cu of curve E (Fig. 1), when
compared with the coarse grained starting material, represents an
elevation of j y by a factor of 5–6 while maintaining comparable
elongation to failure. The simultaneous high strength and ductility,
especially the very large uniform deformation at the elevated
strength, results in an notable gain in toughness (the area under
the stress–strain curve)16. This is what sets this material apart from
all previous treated copper materials, as demonstrated in Fig. 2.
To establish the reproducibility, three additional samples with or
without the ECAP step were processed through similar CWand heat
treatment. In all cases, coexisting high strength and ductility were
observed. Further annealing beyond that shown in Fig. 3b caused
additional grain growth and larger uniform elongation, but with a
large decrease in j y and no gain in overall ductility owing to the
decrease of the post-peak elongation (compare curve A with curve
D, Fig. 1). Attempts to start with the room-temperature-rolled Cu
only managed a j y of ,100 MPa when elongation to failure reached
,50%. This emphasizes the importance of the step at liquid
nitrogen temperature, which stores large cold work energy that
leads to a lower recrystallization temperature (compared with
room-temperature rolling, the calorimetric recrystallization/grain
growth peak temperature decreased by 60 8C) and favours copious
nucleation over growth. This makes it possible to achieve the
Figure 3 Transmission electron micrographs showing the evolution of the Cu
microstructure. Panels a and b show the samples used to obtain the curves D and E in
Fig. 1, respectively. After annealing at 180 8C for 3 min (a), recovery has occurred, and the
dislocation density is much reduced. The vast majority of the grains are in the
nanocrystalline/ultrafine range, with some recrystallized regions. Heat-treating at 200 8C
for 3 min led to full recrystallization followed by secondary recrystallization (b).
© 2002 Nature Publishing Group
913
letters to nature
nanocrystalline/ultrafine grained matrix structure through recrystallization, thus affording room for tailoring the microstructure
through controlled secondary recrystallization15.
Our approach does not use uniform nanocrystalline grains,
which have to rely on grain boundary deformation mechanisms
(such as grain boundary sliding) to contribute significantly to
ductility and stabilize the plastic deformation through large
increases in strain rate sensitivity6,24–26. Experimental data so far
(for example, Fig. 2) indicate that at ambient temperature the
increase in ductility provided by grain boundary sliding in small
grains is either insufficient to compensate for the loss of dislocation
controlled ductility, or concurrent with a much reduced strength2,6.
Our idea of improving strain hardening may be used to derive
good ductility from other nanocrystalline materials, where abnormal grain growth is often observed. For example, after heating to a
moderate temperature nanocrystalline nickel was reported to exhibit a bimodal microstructure and pronounced strain hardening
under certain deformation conditions25–27. In addition to achieving
a combination of strength and ductility, our thermomechanical
approach to the processing of bulk samples is also simpler than
those processes required to produce uniform nanocrystalline grains;
the latter processes are not only difficult or expensive to implement,
but also are difficult to keep free of artefacts such as porosity and
Figure 4 Transmission electron micrographs of Cu after different tensile strains. The Cu
sample is that shown in Fig. 3b. a, after 6% plastic strain; the upper left inset shows the
selected-area electron diffraction pattern, and the lower right inset shows the highresolution image of the boundary region between a larger, micrometre-sized grain (L) and
one of the surrounding much smaller ultrafine grains (S). A twin boundary (TB) is seen near
the ‘tip’ of the S protrusion into L, where twinning is initiated. b, After the maximum
uniform strain of ,30%.
914
impurities. In fact, fracture due to sample flaws after consolidation
or deposition2–4, together with plastic flow instabilities such as
necking and shear banding28, are responsible for the very limited
strain to failure observed so far in nanocrystalline materials.
A
Methods
Pure Cu (99.99%) bar from a commercial source (ESPI) was first processed by severe cold
rolling, with liquid-nitrogen-temperature (LNT) cooling of the workpiece between
consecutive rolling passes (2150 8C and 2100 8C before and after each pass, respectively).
The degree of LNT deformation is defined using per cent cold work29, %CW ¼
ðSo 2 SÞ=So £ 100%; where S o and S are the cross-sectional areas before and after rolling.
Some samples were processed through eight passes of equal channel angular pressing
(ECAP) at room temperature before rolling, while others were subjected directly to LNT
rolling. The ECAP step made no obvious difference to the eventual microstructure and
properties, as the very large cold work energy stored at LNT controls the subsequent
recrystallization behaviour. Microhardness, as well as the recrystallization temperature
and enthalpy storage measured in a calorimetric scan, levels off after about 90% CW.
For mechanical property measurements, all the samples were cut and polished to a
cross-section of 1 mm £ 1.8 mm, and a gauge length of 5 mm (previously reported tensile
tests of nanostructured metals typically used a gauge length in the range of 1–5 mm; refs 2,
5, 6, 25, 26). Uniaxial tensile tests were conducted at room temperature at an initial quasistatic strain rate of 5 £ 1024 s21.
Received 23 April; accepted 12 September 2002; doi:10.1038/nature01133.
1. Koch, C. C., Morris, D. G., Lu, K. & Inoue, A. Ductility of nanostructured materials. Mater. Res. Soc.
Bull. 24, 54–58 (1999).
2. Weertman, J. R. et al. Structure and mechanical behavior of bulk nanocrystalline materials. Mater. Res.
Soc. Bull. 24, 44–50 (1999).
3. Sanders, P. G., Youngdahl, C. J. & Weertman, J. R. The strength of nanocrystalline metals with and
without flaws. Mater. Sci. Eng. A 234–236, 77–82 (1997).
4. Sanders, P. G., Eastman, J. A. & Weertman, J. R. Elastic and tensile behavior of nanocrystalline copper
and palladium. Acta Mater. 45, 4019–4025 (1997).
5. Lergos, M., Elliott, B. R., Rittner, M. N., Weertman, J. R. & Hemker, K. J. Microsample tensile testing of
nanocrystalline metals. Phil. Mag. A 80, 1017–1026 (2000).
6. Valiev, R. Z., Alexandrov, I. V., Zhu, Y. T. & Lowe, T. C. Paradox of strength and ductility in metals
processed by severe plastic deformation. J. Mater. Res. 17, 5–8 (2002).
7. Gertsman, V. Y., Valiev, R. Z., Akhmadeev, N. A. & Mishin, O. V. Deformation behavior of ultrafinegrained materials. Mater. Sci. Forum 225–227, 739–744 (1996).
8. Asgari, S., El-Danaf, E., Kalidindi, S. R. & Doherty, R. D. Strain hardening regimes and
microstructural evolution during large strain compression of low stacking fault energy fcc alloys that
form deformation twins. Metall. Mater. Trans. A 28, 1781–1795 (1997).
9. Andrade, U., Meyers, M. A., Vecchio, K. S. & Chokshi, A. H. Dynamic recrystallization in high-strain,
high-strain-rate plastic deformation of copper. Acta Metall. Mater. 42, 3183–3195 (1994).
10. Youngdahl, C. J., Weertman, J. R., Hugo, R. C. & Kung, H. H. Deformation behavior in nanocrystalline
copper. Scripta Mater. 44, 1475–1478 (2001).
11. Gao, H., Huang, Y., Nix, W. D. & Hutchinson, J. W. Mechanism-based strain gradient plasticity-I.
Theory. J. Mech. Phys. Solids 47, 1239–1263 (1999).
12. Lu, L., Wang, L. B., Ding, B. Z. & Lu, K. High-tensile ductility in nanocrystalline copper. J. Mater. Res.
15, 270–273 (2000).
13. Hughes, D. A. & Hansen, N. High angle boundaries formed by grain subdivision mechanisms. Acta
Mater. 45, 3871–3886 (1997).
14. Wang, Y. M., Ma, E. & Chen, M. W. Enhanced tensile ductility and toughness in nanostructured Cu.
Appl. Phys. Lett. 80, 2395–2397 (2002).
15. Humphreys, F. J. & Hatherly, M. Recrystallization and Related Annealing Phenomena, 1st edn 314
(Pergamon, New York, 1995).
16. Hertzberg, R. W. Deformation and Fracture Mechanics of Engineering Materials, 3rd edn 89, 392 (Wiley
and Sons, New York, 1989).
17. Hart, E. W. Theory of the tensile test. Acta Metall. 15, 351–355 (1967).
18. Dieter, G. E. Mechanical Metallurgy, 3rd edn 290 (McGraw-Hill, Boston, 1986).
19. Jia, D. et al. Deformation behavior and plastic instabilities in ultrafine-grained Ti. Appl. Phys. Lett. 79,
611–613 (2001).
20. Wang, Y. M. & Ma, E. Strain hardening, strain rate sensitivity, and ductility of nanoconstructed metals.
Mater. Sci. Eng. A (in the press).
21. Valiev, R. Z., Islamgaliev, R. K. & Alexandrov, I. V. Bulk nanostructured materials from severe plastic
deformation. Prog. Mater. Sci. 45, 103–189 (2000).
22. Huang, J. Y., Wu, Y. K. & Ye, H. Q. Deformation structures in ball milled copper. Acta Mater. 44,
1211–1221 (1996).
23. Blewitt, T. H., Coltman, R. R. & Redman, J. K. Low-temperature deformation of copper single crystals.
J. Appl. Phys. 28, 651–660 (1957).
24. Lu, L., Sui, M. L. & Lu, K. Superplastic extensibility of nanocrystalline copper at room temperature.
Science 287, 1463–1465 (2000).
25. McFadden, S. X., Mishra, R. S., Valiev, R. Z., Zhilyaev, A. P. & Mukerjee, A. K. Low-temperature
superplasticity in nanostructured nickel and metal alloys. Nature 398, 684–686 (1999).
26. McFadden, S. X., Zhilyaev, A. P., Mishra, R. S. & Mukerjee, A. K. Observation of low-temperature
superplasticity in electroplated ultrafine grained nickel. Mater. Lett. 45, 345–349 (2000).
27. Hibbard, G. D., McCrea, J. L., Palumbo, G., Aust, K. T. & Erb, U. An initial analysis of
mechanisms leading to late stage abnormal grain growth in nanocrystalline Ni. Scripta Mater. 47,
83–87 (2002).
28. Wei, Q. M., Jia, D., Ramesh, K. T. & Ma, E. Evolution and microstructure of shear bands in
nanostructured Fe. Appl. Phys. Lett. 81, 1240–1242 (2002).
29. Callister, W. D. Jr. Materials Science and Engineering, 3rd edn 167 (Wiley and Sons, New York,
1994).
© 2002 Nature Publishing Group
NATURE | VOL 419 | 31 OCTOBER 2002 | www.nature.com/nature
letters to nature
Supplementary Information accompanies the paper on Nature’s website
(ç http://www.nature.com/nature).
Acknowledgements We thank G. Xu, H. Gao, S. X. Mao and D. van Heerden for discussions. This
work was supported by the US National Science Foundation.
Competing interests statement The authors declare that they have no competing financial
interests.
Correspondence and requests for materials should be addressed to E.M.
(e-mail: ema@jhu.edu).
..............................................................
Variable effects of nitrogen
additions on the stability
and turnover of soil carbon
Jason C. Neff*†, Alan R. Townsend†‡§, Gerd Gleixnerk, Scott J. Lehman§,
Jocelyn Turnbull§ & William D. Bowman‡
* Earth Surface Processes Team, Geologic Division, US Geological Survey, MS 980,
Denver Federal Center, Denver, Colorado 80225, USA
‡ Environmental, Population and Organismic Biology; and § Institute for Arctic
and Alpine Research, University of Colorado at Boulder, Boulder, Colorado 80309,
USA
k Max Planck Institute for Biogeochemistry, Jena, Germany
† These authors contributed equally to this work
.............................................................................................................................................................................
Soils contain the largest near-surface reservoir of terrestrial
carbon1 and so knowledge of the factors controlling soil carbon
storage and turnover is essential for understanding the changing
global carbon cycle. The influence of climate on decomposition of
soil carbon has been well documented2,3, but there remains
considerable uncertainty in the potential response of soil carbon
dynamics to the rapid global increase in reactive nitrogen (coming largely from agricultural fertilizers and fossil fuel combustion). Here, using 14C, 13C and compound-specific analyses of soil
carbon from long-term nitrogen fertilization plots, we show that
nitrogen additions significantly accelerate decomposition of
light soil carbon fractions (with decadal turnover times) while
further stabilizing soil carbon compounds in heavier, mineralassociated fractions (with multidecadal to century lifetimes).
Despite these changes in the dynamics of different soil pools,
we observed no significant changes in bulk soil carbon, highlighting a limitation inherent to the still widely used single-pool
approach to investigating soil carbon responses to changing
environmental conditions. It remains to be seen if the effects
observed here—caused by relatively high, short-term fertilizer
additions—are similar to those arising from lower, long-term
additions of nitrogen to natural ecosystems from atmospheric
deposition, but our results suggest nonetheless that current
models of terrestrial carbon cycling do not contain the mechanisms needed to capture the complex relationship between nitrogen availability and soil carbon storage.
Human activity now fixes more atmospheric N2 into biologically
available forms each year than all natural processes combined4,
causing a wide range of cascading environmental responses, including a possible sink for excess atmospheric CO2 through stimulation
of plant growth in N-limited ecosystems5. However, on average,
soils contain three times as much C as does terrestrial vegetation1.
Thus if changes in N availability alter soil C turnover, net C sinks
from increased plant growth could be significantly enhanced or
reduced, depending on the direction of the soil responses. Unfortunately, considerable uncertainty remains concerning the relationship between N availability and decomposition processes. Additions
of N and/or natural variation in N concentrations have led to
increases, decreases or no change in observed decomposition rates.
This is true for field studies of litter and soil organic matter (SOM)
decomposition, as well as for laboratory experiments6–10.
In part, these varied results occur because decomposition studies
are difficult to carry out and interpret. Soils are highly complex
media with a diversity of substrates that vary in both the energy
required for their breakdown and in their total N content. As a
result, additions of N to soils could increase decomposition rates of
some SOM fractions while simultaneously decreasing rates for other
fractions. Past results suggesting widely varied—or no—responses of
decomposition to N inputs may be due to varied and compensatory
responses of SOM fractions that are difficult to detect with traditional measurements, such as mass loss or CO2 efflux.
Data from long-term N-fertilized plots (defined as þN hereafter)
at an alpine site on Niwot Ridge, Colorado, provide an example of
the uncertainties associated with traditional measurements. Fertilized plots in dry meadow communities of alpine tundra at this site
have received annual inputs of 10 g N m22 yr21 since 1990 (ref. 11)
(see Methods section). The decade of N fertilization has greatly
increased productivity; over the past ten years, an average of
72 g m22 yr21 of extra C has entered the fertilized plots (Table 1).
Despite these increases in productivity, soil C concentrations are not
significantly different between control and þN plots (Table 1).
Against the large standing pools of SOM carbon on Niwot Ridge
and elsewhere, large changes in C inputs or alteration of turnover
times rarely result in statistically significant changes in soil C
concentrations12,13.
In contrast to bulk C values, the results of radiocarbon, 13C and
compound-specific analyses of soil C on Niwot Ridge all point to an
acceleration of intermediate-age SOM turnover, and a possible
increase in the stabilization of some forms of C into mineral
SOM pools. Atmospheric testing of atomic weapons in the early
1950s led to a rapid increase in the 14C content of atmospheric CO2,
followed by a gradual decline to the present14 (Fig. 1). The timedependent change in 14CO2 can be used to examine the turnover
time of intermediate-age soil C formed in equilibrium with the
atmosphere. For soil samples, we performed 14C measurements on
‘light’ and ‘heavy’ SOM fractions using a high-density solution. The
heavy fraction is thought to be largely recalcitrant C associated with
soil minerals, with turnover times of several decades to centuries,
while the more labile light fraction reflects a mixture of compounds
that includes microbial biomass, partially degraded plant material
and older, more humified, by-products of decomposition15,16. In the
dry meadow communities on Niwot Ridge, the light fraction is not
significantly altered by fertilization and contributes over half of total
soil C to both control and þN plots (Table 1).
The D14C of incoming plant C determined from summer plant
harvests from 1990 to the present is similar to the D14C of
Table 1 Productivity and soil C and N concentrations on Niwot Ridge
Above ground productivity (g m22 yr21)
%C
Soil C in the light fraction (%)
%N
C:N ratio
...................................................................................................................................................................................................................................................................................................................................................................
Control
þN
151 (11)*
223 (16)†
8.61 (1.12)*
10.40 (1.24)*
55.12 (2.14)*
60.44 (1.91)*
0.67 (0.07)*
0.83 (0.08)*
12.65 (0.74)*
12.37 (0.33)*
...................................................................................................................................................................................................................................................................................................................................................................
Values shown are means with standard errors in parentheses. Statistically significant differences below the P , 0.05 level are shown by contrasting symbols within columns. Average annual productivity
in the control and fertilized plots is significantly different ðF ¼ 54:54; P , 0:001Þ: þN, long term N-fertilized plots.
NATURE | VOL 419 | 31 OCTOBER 2002 | www.nature.com/nature
© 2002 Nature Publishing Group
915
