Operations Management Viewpoint
Procurement Performance Measurement
What CFOs expect from measuring Procurement Success
Procurement excellence is increasingly becoming an important factor in delivering efficient operations within successful
companies. On the surface, effectively measuring procurement performance is no rocket science. However looking deeper,
adequate measurement of procurement success is a big issue, as bottom-up reported savings can significantly deviate from the
key financial figures a CFO looks at. Arthur D. Little’s latest study on procurement performance identifies the key challenges that
companies currently face in developing a CFO-friendly procurement performance measurement. This report suggests a best
practice approach to overcoming these challenges and consistently measuring purchasing success in the future.
Why the views of CFOs and procurement officers
often differ
During a downturn, when companies must consider every
avenue for cutting costs in order to simply survive, the
procurement department plays an increasingly important role in
achieving this strategic goal. A purchasing performance figure
benchmarks the target achievement within the organization while
functioning at the same time as a key performance indicator for
the control and allocation of liquidity respectively assets.
Even if the purpose of a dedicated procurement performance is
not up for discussion, its quantitative measurement remains a big
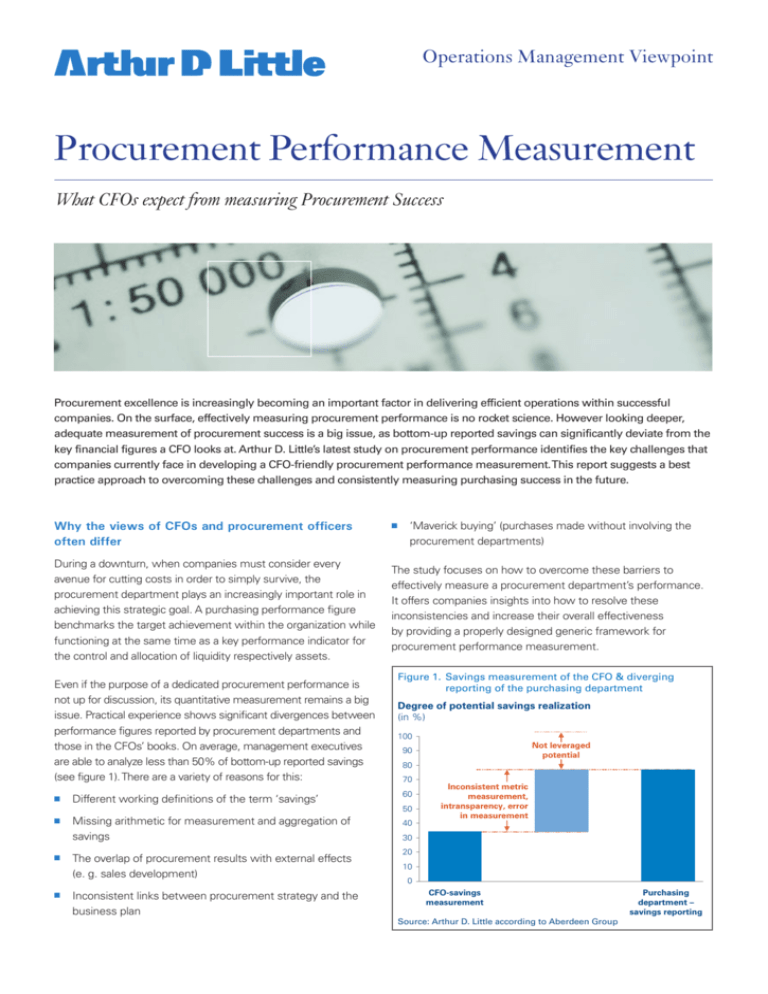
issue. Practical experience shows significant divergences between
performance figures reported by procurement departments and
those in the CFOs’ books. On average, management executives
are able to analyze less than 50% of bottom-up reported savings
(see figure 1). There are a variety of reasons for this:
nn
‘Maverick buying’ (purchases made without involving the
procurement departments)
The study focuses on how to overcome these barriers to
effectively measure a procurement department’s performance.
It offers companies insights into how to resolve these
inconsistencies and increase their overall effectiveness
by providing a properly designed generic framework for
procurement performance measurement.
Figure 1. Savings measurement of the CFO & diverging
reporting of the purchasing department
Degree of potential savings realization
(in %)
100
80
70
nn
Different working definitions of the term ‘savings’
60
nn
Missing arithmetic for measurement and aggregation of
savings
40
nn
nn
The overlap of procurement results with external effects
(e. g. sales development)
Inconsistent links between procurement strategy and the
business plan
Not leveraged
potential
90
50
Inconsistent metric
measurement,
intransparency, error
in measurement
30
20
10
0
CFO-savings
measurement
Source: Arthur D. Little according to Aberdeen Group
Purchasing
department –
savings reporting
Operations Management Viewpoint
Procurement managers’ key challenges1
procurement community has to learn how to speak the CFO’s
language” in order to bridge this gap in performance reporting.
Although procurement should not be directly measured according
to P&L – as it does not influence valuation decisions – the
transition between different metrics must be clearly defined.
In a recent study Arthur D. Little investigated a series of realworld challenges currently facing procurement performance
measurement. The report outlines an innovative approach to
overcoming these challenges, based on a cross-industry best
practice approach (see figure 22).
Setting up a measurement framework
Based on in-depth interviews, Arthur D. Little has observed that
procurement departments tend to be self-critical in regard to the
current inconsistency in their measurement criteria: “Savings
calculated by procurement departments are typically not
aligned with the well-known principles of adequate and orderly
accounting”. This is because the financial framework chosen to
analyze purchasing success is critical to its accurate measurement:
“Most purchasers still think within an ‘internal’ world of cost/
performance accounting according to the ‘amount * price’ principle.
But for a CFO’s controller, the effects of purchasing actions on a
balance sheet and cash flow calculation are critical. Therefore the
CFO doesn’t care about a hypothetical calculation.” In fact, “the
It is also quite evident that “a savings performance indicator
can only claim to be a financial metric if it also includes negative
effects, e. g. taking account of increasing prices.” Against this
background it is quite astonishing that sixty-three per cent of
the procurement departments surveyed simply ignore their
responsibility for rising purchasing costs.
Considering cost avoidance and market price
development
In addition, so called ‘cost avoidance’ has no universal definition
in the procurement world hence the term should be handled
with care. Some refer to it only on initial or one-time purchases,
while others also use the term to refer to rising market prices for
recurring purchases.
Figure 2. Key challenges, practical examples and best practices for procurement performance measurement
Key challenges for procurement
performance measurement
”Practical examples”
Select financial framework for success
evaluation
Mix of repetitive & onetime purchases & indirect/
internal benefits (TCO)
Determine key reference prices
(particularly for initial and one-time
procurement)
Target price/internal cost
requirement
36%
Consider increasing costs
(i. e. rise in prices)
Generally not considered
(“buyer‘s perspective“)
63%
Include & define cost avoidance
Addition to “real“ savings
Î ONE KPI
41%
Include market price development (i. e.
take into account increasing & decreasing
prices)
Consider effects of procurement
decisions over a longer time period
Measure optimized working capital
49%
Transition into P&L & cash
flow/expenditures ensured
together with bookkeeping
Price per offer e. g. best
offer of negotiation
participants
Considered
“Real“ vs. “hypothetic“
savings Î TWO KPI
Within the context of cost avoidance
Short-term one-period
measurement
76%
Poured into the performance measurement via
“other purchasing benefits” or “total value” savings
No “capital-value-based” steering of procurement
Measure the success of decentralized
departments
Consistent performance measurement system
with individual types of targets
No participation of procure- 36%
ment, budget is the baseline
for initial-/one-time purchasing
37%
26%
37%
Define one KPI according to P&L & cash
flow; another KPI according to internal cost/
performance accounting (TCO)
Budget after procurement involvement
based on external market data
Consider increasing costs
36%
Define additional KPI:
“Savings vs. market price development”
54%
Define additional KPI:
“Savings vs. market price development”
12%
Baseline-related for the
year effects incur respectively
Develop a capital- or value-based steering
approach (i. e. EVA*)
Consider the influence of the budgeting
process on performance measurement
Possible best practice approach
52%
89%
96%
Procurement integrated
17%
in cost center planning,
budget targeting measurement
Consider baseline-related for year incurring
Measure only in context of “term of
payment”
“Nice to have approach“, not obligatory
Measure consistently with individual types
of targets
Integrate procurement into the budget
process with cancelation of budget baseline
* EVA = Economic Value Added
Source: Arthur D. Little’s 2009 Procurement Performance Excellence Study and expert interviews with a cross-industry selection of European
multinational companies; percentages indicate the portion of companies that agree with the respective statement
1
2
Quotes are taken from selective interviews with experienced procurement executives across all industries
Percentages give the share of interviewed companies that follow the named approach
2 Procurement Performance Measurement
Operations Management Viewpoint
Forty-one per cent of procurement departments only use one
figure to represent both the nominal ‘cash’ savings compared to
the expenditures of the previous year, as well as the ‘real’ performance measured on market price level. In Arthur D. Little’s
survey, this proved to be a popular issue facing procurement
managers. For instance: “General consideration of market
price development in the context of procurement performance
measurement is a very fair method to evaluate a purchaser’s
output”. However, both cash savings and market price-based
analyses should be stringently represented with separate performance figures in order to avoid a mixture of ‘real’ performance,
and ‘cash’ savings respective ‘cost cutting’ effects.
The budgeting process and value-based controlling
The study revealed that until procurement departments address
and overcome the basic challenges outlined above, their
measurement will not meet further expectations of the CFO.
For instance, eighty-nine per cent of the companies interviewed
believe that value-based steering of procurement is not a
critical business issue of the day. However, as procurement
departments become increasingly involved in the budgeting
process, it will become more important to consider payment
terms. Seventeen per cent of the procurement departments
interviewed for this study already play an active role in their
organization’s budget process. With this trend set to grow it
will become clear that “savings measurement with a budget
baseline often leads to a so-called ‘sourcing dilemma,’ since
procurement defines its own measuring criteria.”
Budget is only an incentive-compatible baseline if the
procurement department is not involved in the budgeting
process. In companies where this is not the case, the CFO
should define an alternative target against which to measure
success.
2. Period reference: Which measuring point and reference
date are used? (e. g. annual budget versus actual figures)
3. Depth of examination: To what extent is value creation
measured in the context of purchasing? For instance, does
the measurement system only consider material costs, or
also follow-up costs? Where is the functional reference base
for measurement? (e. g. last year’s prices or budget/target
prices versus actual market prices)
Different aspects of these three dimensions must be combined
and target-oriented according to the specific purposes for measurement within an organization. However, all companies can
increase the transparency of their procurement measurement by
agreeing upon selective, generic definitions for the four different
key figures used to explain the depth of examination:
nn
‘Cash savings’: Financially measurable changes in
expenditure3, which are directly influenced by purchasing.
Procurement departments must determine an “internal”
reference price as a precondition for measuring cost
reduction. For example, reducing leasing rates for the car
fleet by 10% compared to last year’s rates results in a 10%
cash savings.
nn
‘Savings vs. market price development’: Measuring
expenditure versus market price development involves
determining market price as a precondition, and takes
particular account of ‘cost avoidance’ (e. g. defense against
price increases). For example, since the market price index
of car leasing rates shows a 15% decrease compared to last
year, our 10% ‘cash saving’ is not more than a –5% negative
‘saving vs. market price development’.
nn
‘Total value savings’: Change in direct and indirect costs
(TCO/TVO4 approach) caused by purchasing; this also includes
follow-up costs (e. g. for storage), as well as the evaluation
of process efficiencies and changing risk positions (e. g.
consequences of supplier’s shortfall). This figure is calculated in
addition to ‘cash savings’. For example, since our new leasing
rates include administration benefits, we reduce internal
administration costs by 5% relative to leasing rates, which
means ‘total value savings’ of 15% compared to last year.
nn
‘Contribution to return on capital’: Measuring
procurement’s contribution to return on capital includes
changes in capital costs, and comprises all contributions of
purchasing to changing deployed or fixed capital. Savings
are therefore also set relative to used capital. This figure is
calculated in addition to ‘total value savings’. Example: The
new fleet leasing contract generates positive impact on
capital costs through its provision of value insurance and
termination options.
Recommended best practice approach for a proper
performance measurement
The first and most important challenge for procurement
departments and their CFOs is to design a consistent
framework for financial evaluation of procurement performance.
To help companies develop such a framework, it is useful
to draw a model along the following three dimensions. The
final model should, of course, implicitly consider the above
mentioned recommendations and further key challenges as
outlined in figure 2.
1. Metric of measurement: Which financial figures and
valuation of assets are considered for measurement?
(e. g. P&L respective balance sheet or cash flow calculation
respective cash-based accounting or cost-/performance
accounting)
3 Specifically, the terms ’payout’ ‘expenses,’ or ‘costs’ are needed here
4 TCO: Total Cost of Ownership; TVO: Total Value of Ownership
3 Procurement Performance Measurement
Operations Management Viewpoint
The suggested framework and best practice examples outlined
above provide an important understanding of consistent
performance measurement. The general framework should
serve as a guide to companies, and can be customized to meet
their specific needs.
Contacts
Carsten Vollrath
Managing Director
Global Head Operations Management Practice
vollrath.carsten@adlittle.com
Arthur D. Little’s insight
The above-mentioned core characteristics of an innovative
procurement performance measurement have been
identified by combining results from Arthur D. Little’s ongoing
Procurement Performance Excellence5 study with findings from
selected expert interviews. The interviews with decision makers
in more than ten different industries elicited up-to-date, practical
examples, and illustrated some misconceptions concerning
current performance measurement practices. By naming the
key measurement challenges facing today’s procurement
departments, this report provides a framework to outline current
procedures and identify future best practice.
Thiemo Rehländer
Director
Global Head Financial Services Practice
rehlaender.thiemo@adlittle.com
Matthias Riveiro
Principal
Financial Services Practice
riveiro.matthias@adlittle.com
Dr. Gregor Berz
Conclusion – how CFOs measure the future
As mentioned above, any CFO-friendly performance
measurement system will clearly differentiate between the
popular terms ‘cost reduction’, ‘cost avoidance’, ‘total cost of
ownership’, and ‘optimization of net present value’. By designing
a clear measurement framework that takes into account
consistent metrics, time frames, and levels of examination,
procurement departments and CFOs can achieve transparent
performance measurement from the start. With a consistent
measurement system in place, it is possible for businesses
to understand the true value of their target-oriented cost
reductions, based on more well-defined and customized
savings figures. Arthur D. Little helps its clients to customize
this framework to the specific needs and requirements to suit
organizational structures and reporting processes.
Principal
Operations Management Practice
berz.gregor@adlittle.com
Additional author of this Viewpoint is
Dr. Michael Eberhardt, Consultant Financial Services Practice
Arthur D. Little
Arthur D. Little, founded in 1886, is a global leader in
management consultancy; linking strategy, innovation
and technology with deep industry knowledge. We offer
our clients sustainable solutions to their most complex
business problems. Arthur D. Little has a collaborative
client engagement style, exceptional people and a firm-wide
commitment to quality and integrity. The firm has over
30 offices worldwide. With its partner Altran Technologies
Arthur D. Little has access to a network of over 18,000
professionals. Arthur D. Little is proud to serve many of the
Fortune 100 companies globally, in addition to many other
leading firms and public sector organizations. For further
information please visit www.adl.com
Copyright © Arthur D. Little 2009. All rights reserved.
5 PPE: Procurement Performance Excellence, compare
www.adl.com/OperationalPerformanceExcellence
www.adl.com/ProcurementPerformanceMeasurement


