KRAFT FOODS INC. NDQ-KFT
TIMELINESS
SAFETY
TECHNICAL
3
1
3
High:
Low:
Raised 5/20/11
35.6
29.5
RECENT
PRICE
43.9
32.5
39.4
26.3
36.1
29.5
17.8 RELATIVE
DIV’D
Median: 16.0) P/E RATIO 1.09 YLD 2.9%
39.80 P/ERATIO 15.9(Trailing:
35.7
27.9
36.7
27.4
37.2
30.0
35.0
24.8
29.8
20.8
32.7
27.1
37.9
30.2
40.0
36.8
Target Price Range
2015 2016 2017
LEGENDS
13.0 x ″Cash Flow″ p sh
. . . . Relative Price Strength
Options: Yes
Shaded areas indicate recessions
Raised 11/7/03
Raised 7/27/12
BETA .65 (1.00 = Market)
VALUE
LINE
120
100
80
64
48
2015-17 PROJECTIONS
Ann’l Total
Price
Gain
Return
High
65 (+65%) 15%
Low
55 (+40%) 11%
Insider Decisions
to Buy
Options
to Sell
S
0
0
0
O
0
0
0
N
0
0
0
D
0
0
0
J
0
0
0
F
0
0
0
M
0
1
1
A
0
0
0
32
24
20
16
12
M
0
0
0
% TOT. RETURN 6/12
Institutional Decisions
3Q2011
4Q2011
1Q2012
510
478
492
to Buy
to Sell
430
450
495
Hld’s(000)129317612732201278938
Percent
shares
traded
15
10
5
Kraft Foods Inc. was formed in 1989 when
Philip Morris (now Altria Group) merged
General Foods Corporation (which it acquired in 1985) with Kraft Inc. (acquired in
1988). In December of 2000, the company
acquired Nabisco Holding Corporation. The
company completed its initial public offering
of 280 million shares at $31 each on June
12, 2001. Net proceeds totaled roughly $8.7
billion. Credit Suisse First Boston and
Salomon Smith Barney were the lead underwriters. Philip Morris retained an 84%
stake in Kraft, which it has since spun off.
2009
2010
2011
2012
2013
Calendar
2009
2010
2011
2012
2013
Calendar
2008
2009
2010
2011
2012
-4.1
68.8
19.0
© VALUE LINE PUB. LLC
15-17
Sales per sh
‘‘Cash Flow’’ per sh
Earnings per sh A
Div’ds Decl’d per sh B
Cap’l Spending per sh
Book Value per sh E
Common Shs Outst’g C
Avg Ann’l P/E Ratio
Relative P/E Ratio
Avg Ann’l Div’d Yield
38.00
4.65
3.70
1.60
1.25
30.75
1790.0
16.0
1.05
2.7%
29709 31010 32168 34113 34356 37241 42777 40386
23.5% 21.9% 19.5% 17.8% 17.9% 15.6% 14.7% 16.0%
716.0 813.0 879.0 879.0 898.0 899.0 986.0 931.0
3505.0 3452.0 3205.0 3183.0 3203.0 2906.0 2844.0 3021.0
35.5% 34.9% 32.3% 30.3% 31.7% 31.2% 30.2% 29.4%
11.8% 11.1% 10.0%
9.3%
9.3%
7.8%
6.6%
7.5%
287.0 263.0 644.0 d571.0 d2219 d6349 322.0 963.0
10416 11591 9723.0 8475.0 7081.0 12902 18589 18024
25832 28530 29911 29593 28555 27295 22200 25972
10.4%
9.2%
8.7%
9.0%
9.8%
8.1%
8.5%
8.3%
13.6% 12.1% 10.7% 10.8% 11.2% 10.6% 12.8% 11.6%
9.9%
8.3%
6.4%
5.9%
5.7%
4.6%
5.3%
5.0%
27%
32%
40%
45%
49%
56%
58%
57%
49207 54365
16.3% 16.0%
1440.0 1485.0
3477.0 4062.0
27.4% 23.5%
7.1%
7.5%
561.0 d2243
26859 23095
35942 35328
7.0%
8.6%
9.7% 11.5%
3.6%
5.7%
63%
50%
Sales ($mill)
Operating Margin
Depreciation ($mill)
Net Profit ($mill)
Income Tax Rate
Net Profit Margin
Working Cap’l ($mill)
Long-Term Debt ($mill)
Shr. Equity ($mill)
Return on Total Cap’l
Return on Shr. Equity
Retained to Com Eq
All Div’ds to Net Prof
68000
18.0%
1700
6625
28.0%
9.7%
1000
27500
55000
9.0%
12.0%
7.0%
43%
BUSINESS: Kraft Foods Inc. is the largest branded food and
beverage company headquartered in the U.S. and second largest
worldwide. The company markets many of the world’s leading food
brands, including Kraft cheese, Cadbury candy, Maxwell House and
Jacobs coffee, Nabisco cookies and crackers, Philadelphia cream
cheese, and Oscar Mayer meats. Its products are currently sold in
roughly 170 countries around the globe. North American sales accounted for 46% of ’11 total; International, 54%. Acq. Nabisco,
12/00; Cadbury, 2/10. Has about 126,000 employees. Officers &
Directors own less than 1% of stock (3/12 Proxy). Chairman &
CEO: Irene B. Rosenfeld. Address: Three Lakes Drive, Northfield,
IL 60093. Telephone: 847-646-2000. Internet: www.kraft.com.
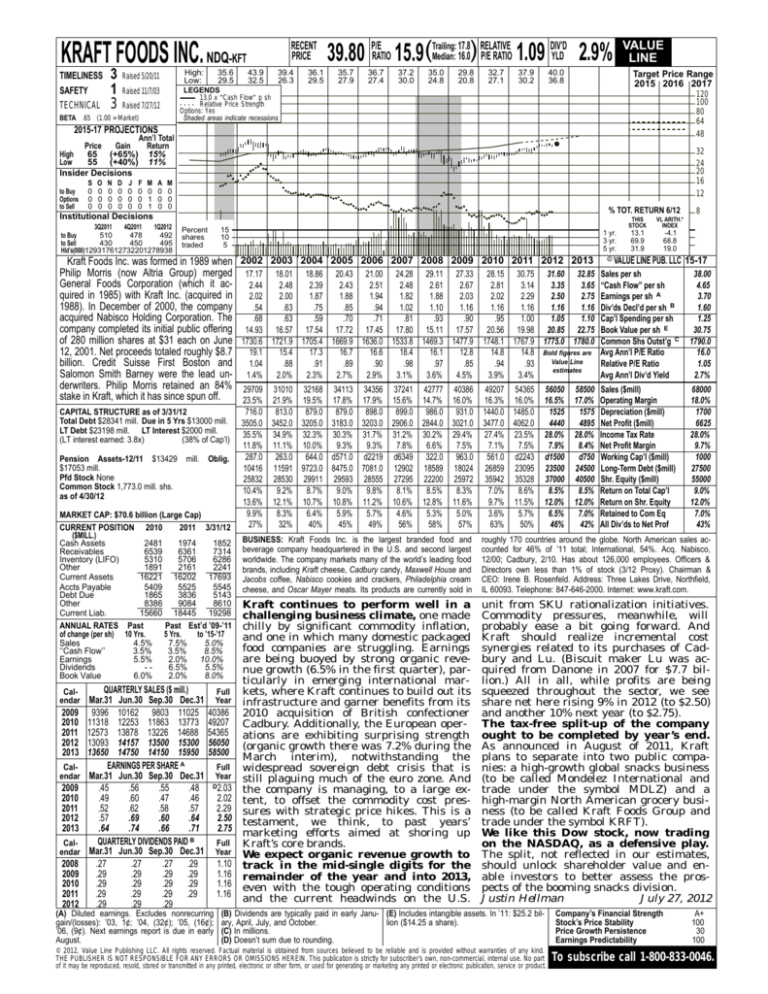
Kraft continues to perform well in a
challenging business climate, one made
chilly by significant commodity inflation,
and one in which many domestic packaged
food companies are struggling. Earnings
are being buoyed by strong organic revenue growth (6.5% in the first quarter), particularly in emerging international marFull kets, where Kraft continues to build out its
Year infrastructure and garner benefits from its
40386 2010 acquisition of British confectioner
49207 Cadbury. Additionally, the European oper54365 ations are exhibiting surprising strength
56050 (organic growth there was 7.2% during the
58500 March interim), notwithstanding the
Full widespread sovereign debt crisis that is
Year still plaguing much of the euro zone. And
D2.03
the company is managing, to a large ex2.02 tent, to offset the commodity cost pres2.29 sures with strategic price hikes. This is a
2.50 testament, we think, to past years’
2.75
marketing efforts aimed at shoring up
Full Kraft’s core brands.
Year We expect organic revenue growth to
1.10 track in the mid-single digits for the
1.16 remainder of the year and into 2013,
1.16 even with the tough operating conditions
1.16 and the current headwinds on the U.S.
unit from SKU rationalization initiatives.
Commodity pressures, meanwhile, will
probably ease a bit going forward. And
Kraft should realize incremental cost
synergies related to its purchases of Cadbury and Lu. (Biscuit maker Lu was acquired from Danone in 2007 for $7.7 billion.) All in all, while profits are being
squeezed throughout the sector, we see
share net here rising 9% in 2012 (to $2.50)
and another 10% next year (to $2.75).
The tax-free split-up of the company
ought to be completed by year’s end.
As announced in August of 2011, Kraft
plans to separate into two public companies: a high-growth global snacks business
(to be called Mondelez International and
trade under the symbol MDLZ) and a
high-margin North American grocery business (to be called Kraft Foods Group and
trade under the symbol KRFT).
We like this Dow stock, now trading
on the NASDAQ, as a defensive play.
The split, not reflected in our estimates,
should unlock shareholder value and enable investors to better assess the prospects of the booming snacks division.
Justin Hellman
July 27, 2012
mill. Oblig.
QUARTERLY SALES ($ mill.)
Mar.31 Jun.30 Sep.30 Dec.31
9396 10162 9803 11025
11318 12253 11863 13773
12573 13878 13226 14688
13093 14157 13500 15300
13650 14750 14150 15950
EARNINGS PER SHARE A
Mar.31 Jun.30 Sep.30 Dec.31
.45
.56
.55
.48
.49
.60
.47
.46
.52
.62
.58
.57
.57
.69
.60
.64
.64
.74
.66
.71
QUARTERLY DIVIDENDS PAID B
Mar.31 Jun.30 Sep.30 Dec.31
.27
.27
.27 .29
.29
.29
.29 .29
.29
.29
.29 .29
.29
.29
.29 .29
.29
.29
.29
13.1
69.9
31.9
8
28.15 30.75 31.60 32.85
2.81
3.14
3.35
3.65
2.02
2.29
2.50
2.75
1.16
1.16
1.16
1.16
.95
1.00
1.05
1.10
20.56 19.98 20.85 22.75
1748.1 1767.9 1775.0 1780.0
14.8
14.8 Bold figures are
Value Line
.94
.93
estimates
3.9%
3.4%
MARKET CAP: $70.6 billion (Large Cap)
CURRENT POSITION 2010
2011 3/31/12
($MILL.)
Cash Assets
2481
1974
1852
Receivables
6539
6361
7314
Inventory (LIFO)
5310
5706
6286
Other
1891
2161
2241
Current Assets
16221 16202 17693
Accts Payable
5409
5525
5545
Debt Due
1865
3836
5143
Other
8386
9084
8610
Current Liab.
15660 18445 19298
ANNUAL RATES Past
Past Est’d ’09-’11
of change (per sh) 10 Yrs.
5 Yrs.
to ’15-’17
Sales
4.5%
7.5%
5.0%
‘‘Cash Flow’’
3.5%
3.5%
8.5%
Earnings
5.5%
2.0% 10.0%
Dividends
-6.5%
5.5%
Book Value
6.0%
2.0%
8.0%
Calendar
2002 2003 2004 2005 2006 2007 2008 2009 2010 2011 2012 2013
VL ARITH.*
INDEX
17.17 18.01 18.86 20.43 21.00 24.28 29.11 27.33
2.44
2.48
2.39
2.43
2.51
2.48
2.61
2.67
2.02
2.00
1.87
1.88
1.94
1.82
1.88
2.03
.54
.63
.75
.85
.94
1.02
1.10
1.16
.68
.63
.59
.70
.71
.81
.93
.90
14.93 16.57 17.54 17.72 17.45 17.80 15.11 17.57
1730.6 1721.9 1705.4 1669.9 1636.0 1533.8 1469.3 1477.9
19.1
15.4
17.3
16.7
16.6
18.4
16.1
12.8
1.04
.88
.91
.89
.90
.98
.97
.85
1.4%
2.0%
2.3%
2.7%
2.9%
3.1%
3.6%
4.5%
CAPITAL STRUCTURE as of 3/31/12
Total Debt $28341 mill. Due in 5 Yrs $13000 mill.
LT Debt $23198 mill. LT Interest $2000 mill.
(LT interest earned: 3.8x)
(38% of Cap’l)
Pension Assets-12/11 $13429
$17053 mill.
Pfd Stock None
Common Stock 1,773.0 mill. shs.
as of 4/30/12
1 yr.
3 yr.
5 yr.
THIS
STOCK
(A) Diluted earnings. Excludes nonrecurring
gain/(losses): ’03, 1¢; ’04, (32¢); ’05, (16¢);
’06, (9¢). Next earnings report is due in early
August.
56050
16.5%
1525
4440
28.0%
7.9%
d1500
23500
37000
8.5%
12.0%
6.5%
46%
(B) Dividends are typically paid in early Janu- (E) Includes intangible assets. In ’11: $25.2 bilary, April, July, and October.
lion ($14.25 a share).
(C) In millions.
(D) Doesn’t sum due to rounding.
© 2012, Value Line Publishing LLC. All rights reserved. Factual material is obtained from sources believed to be reliable and is provided without warranties of any kind.
THE PUBLISHER IS NOT RESPONSIBLE FOR ANY ERRORS OR OMISSIONS HEREIN. This publication is strictly for subscriber’s own, non-commercial, internal use. No part
of it may be reproduced, resold, stored or transmitted in any printed, electronic or other form, or used for generating or marketing any printed or electronic publication, service or product.
58500
17.0%
1575
4895
28.0%
8.4%
d750
24500
40500
8.5%
12.0%
7.0%
42%
Company’s Financial Strength
Stock’s Price Stability
Price Growth Persistence
Earnings Predictability
A+
100
30
100
To subscribe call 1-800-833-0046.

