Financial Statement Assumptions
advertisement
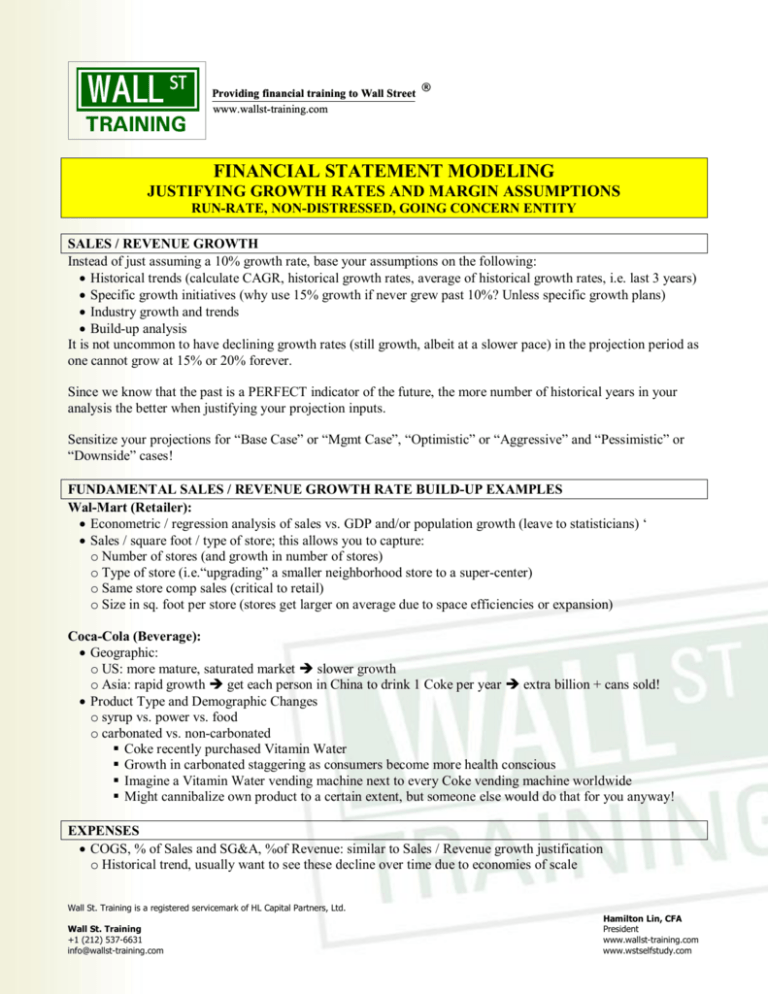
WALL ST TRAINING Providing financial training to Wall Street www.wallst-training.com ® FINANCIAL STATEMENT MODELING JUSTIFYING GROWTH RATES AND MARGIN ASSUMPTIONS RUN-RATE, NON-DISTRESSED, GOING CONCERN ENTITY SALES / REVENUE GROWTH Instead of just assuming a 10% growth rate, base your assumptions on the following: · Historical trends (calculate CAGR, historical growth rates, average of historical growth rates, i.e. last 3 years) · Specific growth initiatives (why use 15% growth if never grew past 10%? Unless specific growth plans) · Industry growth and trends · Build-up analysis It is not uncommon to have declining growth rates (still growth, albeit at a slower pace) in the projection period as one cannot grow at 15% or 20% forever. Since we know that the past is a PERFECT indicator of the future, the more number of historical years in your analysis the better when justifying your projection inputs. Sensitize your projections for “Base Case” or “Mgmt Case”, “Optimistic” or “Aggressive” and “Pessimistic” or “Downside” cases! FUNDAMENTAL SALES / REVENUE GROWTH RATE BUILD-UP EXAMPLES Wal-Mart (Retailer): · Econometric / regression analysis of sales vs. GDP and/or population growth (leave to statisticians) ‘ · Sales / square foot / type of store; this allows you to capture: o Number of stores (and growth in number of stores) o Type of store (i.e.“upgrading” a smaller neighborhood store to a super-center) o Same store comp sales (critical to retail) o Size in sq. foot per store (stores get larger on average due to space efficiencies or expansion) Coca-Cola (Beverage): · Geographic: o US: more mature, saturated market è slower growth o Asia: rapid growth è get each person in China to drink 1 Coke per year è extra billion + cans sold! · Product Type and Demographic Changes o syrup vs. power vs. food o carbonated vs. non-carbonated § Coke recently purchased Vitamin Water § Growth in carbonated staggering as consumers become more health conscious § Imagine a Vitamin Water vending machine next to every Coke vending machine worldwide § Might cannibalize own product to a certain extent, but someone else would do that for you anyway! EXPENSES · COGS, % of Sales and SG&A, %of Revenue: similar to Sales / Revenue growth justification o Historical trend, usually want to see these decline over time due to economies of scale Wall St. Training is a registered servicemark of HL Capital Partners, Ltd. Wall St. Training +1 (212) 537-6631 info@wallst-training.com Hamilton Lin, CFA President www.wallst-training.com www.wstselfstudy.com WALL ST TRAINING Providing financial training to Wall Street www.wallst-training.com ® FINANCIAL STATEMENT MODELING JUSTIFYING OTHER ASSUMPTIONS RUN-RATE, NON-DISTRESSED, GOING CONCERN ENTITY DEPRECIATION EXPENSE · Ideal detailed build-up approach (absent actual projections from company internal accounting system) o Depreciate existing Net PPE based on estimated remaining useful life of each separate asset o Useful life inputs can be found on any MD&A; remember, land is not depreciated o Depreciate new Capital Expenditures based on estimated weighted average useful life of all (new) assets · % of Revenue: fair approach if historical % of Revenue has been fairly constant and consistent; should result in similar numbers WORKING CAPITAL · Use concept of Cash Conversion Cycle and Days Outstanding formulas for non-service based entities o Days Inventory Outstanding: Inventory * 365 / COGS o Days Receivable Outstanding: AR * 365 / Revenue o Days Payable Outstanding: AP * 365 / (COGS+SG&A) · % of Revenue (usually 1% – 2% or base on historical percentages) · % of Change in Revenue (usually 1% – 2% or base on historical percentages) · 30 or 60 Days Working Capital changes o Calculate Working Capital requirement: take Total Operating Expenses (usually, COGS+SG&A, do not include D&A or interest) and divide by either 12 (30 days or 1 month) or 6 (60 days or 2 months) o Take the difference each year è that is your Change in Working Capital (usually a cash flow out) o Rationale: when a company is sold, a minimum working capital requirement is usually part of the termsheet; this is the working capital required to run and sustain the business and day-to-day operations, else the acquiror would have to inject more capital into the business, raising the implied purchase price CAPITAL EXPENDITURES · Next fiscal year estimate is usually supplied by management in any MD&A · For subsequent years, CapEx can be estimated as follows: o Keep constant each year o $ change (based on historical CapEx if relevant) o %age change (based on historical CapEx if relevant) o Average of last 3 years (usually CapEx grows each year, so for a “normal” trend, this projects a decline) · We don’t think it’s ideal to use the following approaches: o % of Revenue è in theory, Revenue lags CapEx; while you may get a stable trend, it’s reverse logic o % of D&A è in theory, D&A is a function of a very precise, identifiable CapEx calculation; avoid this o % of Net or Gross PPE è in theory, PPE is a function of CapEx; avoid this method for sure! . Wall St. Training is a registered servicemark of HL Capital Partners, Ltd. Wall St. Training +1 (212) 537-6631 info@wallst-training.com Hamilton Lin, CFA President www.wallst-training.com www.wstselfstudy.com WALL ST TRAINING Providing financial training to Wall Street www.wallst-training.com ® FINANCIAL STATEMENT MODELING JUSTIFYING OTHER ASSUMPTIONS RUN-RATE, NON-DISTRESSED, GOING CONCERN ENTITY DEFERRED TAX ASSETS & LIABILITIES (DTA & DTL) · Deferred taxes only occur due to temporary differences in taxes that will reverse · Permanent differences in taxes result in immediate increase / decrease to effective tax rate (vs. statutory rate) · DTAs arise primarily due to NOLs (Net Operating Losses) o Future benefit to be used to offset future taxes o Calculated as Net change in NOL x Future estimated statutory tax rate · DTLs arise primarily due to difference between book (GAAP) and tax depreciation o GAAP depreciation assumes straight-line (pro-rata) over life of asset o TAX depreciation assumes accelerated depreciation over life of asset (in USA, MACRS applies) o Thus, in the early years of an asset’s life, a larger depreciation expense results in lower Taxable Income and thus, lower taxes; this reverses in the later years; if a company keeps adding to its asset base, sometimes this results in a permanent change and increases Retained Earnings, a non-P&L impact · Other temporary differences include: FMV step-up in mergers, pension and OPEB recognition among others · Other permanent differences include life insurance premiums and payouts among others · Temporary differences are reconciled in M1 schedule for US corporations’ tax returns Wall St. Training is a registered servicemark of HL Capital Partners, Ltd. Wall St. Training +1 (212) 537-6631 info@wallst-training.com Hamilton Lin, CFA President www.wallst-training.com www.wstselfstudy.com

