Representations: The Dog Ate My Homework!
advertisement

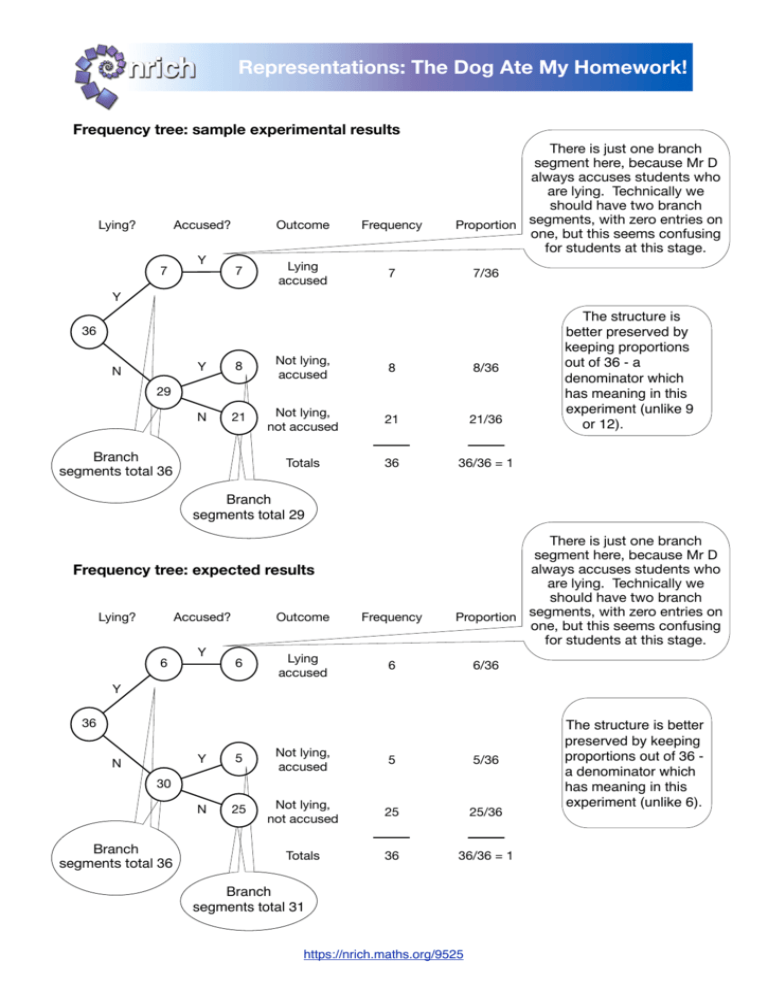
! Representations: The Dog Ate My Homework! Frequency tree: sample experimental results Lying? Accused? 7 Y 7 Outcome Frequency Lying accused 7 There is just one branch segment here, because Mr D always accuses students who are lying. Technically we should have two branch segments, with zero entries on Proportion one, but this seems confusing for students at this stage. 7/36 Y 36 N Y 8 Not lying, accused 8 8/36 N 21 Not lying, not accused 21 21/36 Totals 36 36/36 = 1 29 Branch Branch segments segments total 36 total 36 The structure is better preserved by keeping proportions out of 36 - a denominator which has meaning in this experiment (unlike 9 or 12). Branch segments total 29 10 Frequency tree: expected results Lying? Accused? 6 Y 6 Outcome Frequency Lying accused 6 There is just one branch segment here, because Mr D always accuses students who are lying. Technically we should have two branch segments, with zero entries on Proportion one, but this seems confusing for students at this stage. 6/36 Y 36 N Y 5 Not lying, accused 5 5/36 N 25 Not lying, not accused 25 25/36 Totals 36 36/36 = 1 30 Branch Branch segments segments total 36 total 36 Branch segments total 31 10 https://nrich.maths.org/9525 The structure is better preserved by keeping proportions out of 36 a denominator which has meaning in this experiment (unlike 6). Analysis - The Dog Ate My Homework 2! Probability Tree Lying? 1/6 5/6 Accused? Outcome Expected proportion Probability 1 Y Lying, accused 6/36 = 1/6 1/6 = 1/6 x 1 0 N Lying, not accused 0 0 = 1/6 x 0 1/6 Y Not lying, accused 5/36 5/36 = 5/6 x 1/6 5/6 N Not lying, not accused 25/36 25/36 = 5/6 x 5/6 Totals 1 1 Y N On a frequency tree, the total for each pair of branch segments is equal to the previous value, from which they fork. On a probability tree the sum of the probabilities on each pair of branch segments is 1. In this problem, the probabilities change, because the events on the branch segments are different - whether the student is lying or not on the first set, and whether the student is accused or not on the second. Although we omitted the branch segment corresponding to a lying student not being accused on the frequency tree, to avoid confusion for students, a full analysis of the probabilities requires this case to be considered - of course, the probability of it occurring in the scenario in the problem is zero. Students who are ahead of the class could be asked to consider how it would change things if this probability were not zero. From expected proportions to probability calculations The expected proportion of the 36 trials is equivalent to the probability that a particular outcome occurs. Starting from this as the answer enables students to see how the probability calculation (multiplying along the branches) mirrors the process by which they obtained the expected frequency of each outcome: On average, 1/6 of the students will be lying because there is 1 chance in 6 of the die giving a 6. Hence, on average, 30 or 5/6 of them will not be lying. All the students found to be lying, 1/6 of the total, will be accused by Mr Detector. This is equivalent to multiplying 1/6 by 1. Multiplying 1/6 by 0 gives the zero proportion who are lying but not accused. Of the students who are not lying, on average 1/6 will be accused wrongly, because there is a 1 in 6 chance of the die giving a 1. Hence, on average, 1/6 of the 30 telling the truth will be accused, which is 5, a proportion of 5/36. This is equivalent to multiplying 5/6 by 1/6. Of the students who are not lying, on average 5/6 will not be accused, therefore, and so on average 25 students will be telling the truth and not accused, a proportion of 25/36. This is equivalent to multiplying 5/6 by 5/6. https://nrich.maths.org/9525 Analysis - The Dog Ate My Homework! 3 2-way Tables and Venn Diagrams Sample experimental results Accused? Y N Lying totals Y 7 0 7 N 8 21 29 Accused totals 15 21 36 Lying? Notice where figures from the tree are displayed on the 2-way table. Which are not on the tree? How do we find them there? 21 Lying Accused 0 7 It can be tricky to label the circles correctly on a Venn diagram. They correspond to the two stages of the tree diagram - so the circles represent students who are lying and students who are accused. 8 Expected results Accused Y N Lying totals Y 6 0 6 N 5 25 30 Accused totals 11 25 36 Lying? Lying, not accused 25 Lying 0 Not lying, not accused Not lying, accused Accused 6 5 Lying, accused https://nrich.maths.org/9525 Notice where figures are displayed on the 2-way table which are not on the Venn diagram. How do we find them here?


