Vodacom annual results presentation
advertisement
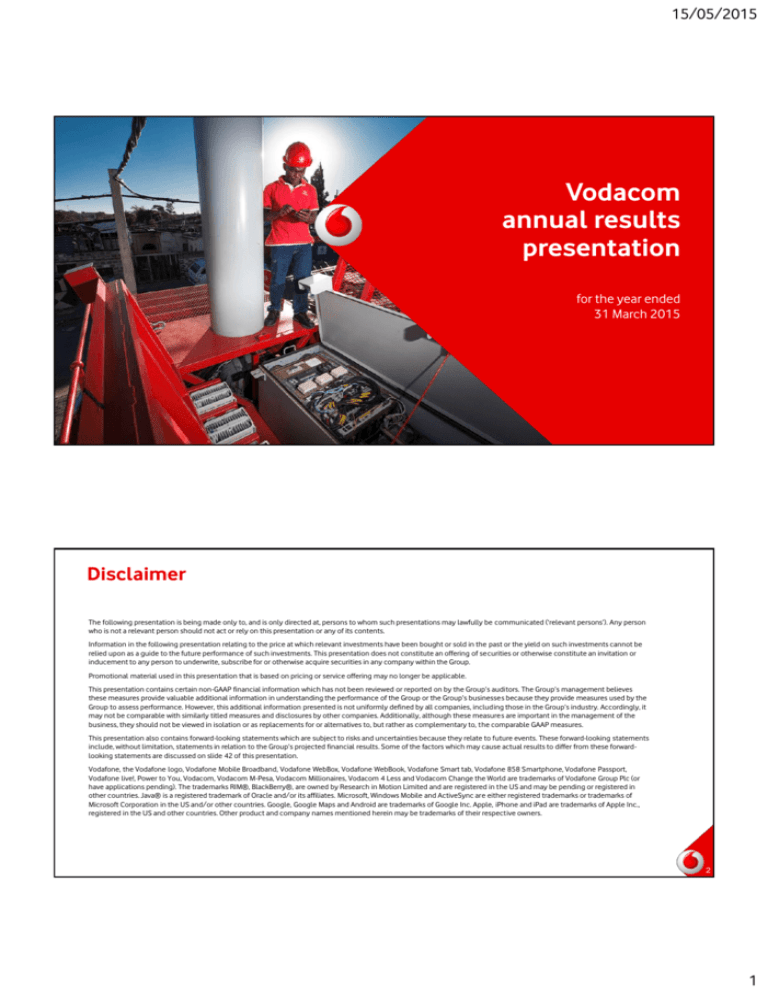
15/05/2015 Vodacom annual results presentation for the year ended 31 March 2015 Disclaimer The following presentation is being made only to, and is only directed at, persons to whom such presentations may lawfully be communicated (‘relevant persons’). Any person who is not a relevant person should not act or rely on this presentation or any of its contents. Information in the following presentation relating to the price at which relevant investments have been bought or sold in the past or the yield on such investments cannot be relied upon as a guide to the future performance of such investments. This presentation does not constitute an offering of securities or otherwise constitute an invitation or inducement to any person to underwrite, subscribe for or otherwise acquire securities in any company within the Group. Promotional material used in this presentation that is based on pricing or service offering may no longer be applicable. This presentation contains certain non-GAAP financial information which has not been reviewed or reported on by the Group’s auditors. The Group’s management believes these measures provide valuable additional information in understanding the performance of the Group or the Group’s businesses because they provide measures used by the Group to assess performance. However, this additional information presented is not uniformly defined by all companies, including those in the Group’s industry. Accordingly, it may not be comparable with similarly titled measures and disclosures by other companies. Additionally, although these measures are important in the management of the business, they should not be viewed in isolation or as replacements for or alternatives to, but rather as complementary to, the comparable GAAP measures. This presentation also contains forward-looking statements which are subject to risks and uncertainties because they relate to future events. These forward-looking statements include, without limitation, statements in relation to the Group’s projected financial results. Some of the factors which may cause actual results to differ from these forwardlooking statements are discussed on slide 42 of this presentation. Vodafone, the Vodafone logo, Vodafone Mobile Broadband, Vodafone WebBox, Vodafone WebBook, Vodafone Smart tab, Vodafone 858 Smartphone, Vodafone Passport, Vodafone live!, Power to You, Vodacom, Vodacom M-Pesa, Vodacom Millionaires, Vodacom 4 Less and Vodacom Change the World are trademarks of Vodafone Group Plc (or have applications pending). The trademarks RIM®, BlackBerry®, are owned by Research in Motion Limited and are registered in the US and may be pending or registered in other countries. Java® is a registered trademark of Oracle and/or its affiliates. Microsoft, Windows Mobile and ActiveSync are either registered trademarks or trademarks of Microsoft Corporation in the US and/or other countries. Google, Google Maps and Android are trademarks of Google Inc. Apple, iPhone and iPad are trademarks of Apple Inc., registered in the US and other countries. Other product and company names mentioned herein may be trademarks of their respective owners. 2 1 15/05/2015 Salient features 3 Performance 2.1% R77 333m Group revenue 25.0% R16 584m Group data revenue 4.0% 1.5% 7.2% 61.6m Group active customers 6.1% R26 905m 860 cents ps 775 cents ps Group EBITDA HEPS Dividend ps 4 2 15/05/2015 Challenging macro environment Challenging environment Regulatory challenges Intensifying competition Pressure on SA consumer spending Pressure on costs 5 Operating review 2015 Carbon disclosure project: 96% score retaining lead in telecoms sector 6 3 15/05/2015 South Africa: Service revenue supported by strong data revenue • +1.5% service revenue (excl MTR) growth +4.2% EBITDA (excl MTR) growth 2015 % change • • +0.4% revenue boosted by 12.2% increase in equipment sales Revenue (Rm) 62 037 0.4 • +23.4% data revenue growth Service revenue (Rm) 47 032 (2.7) EBITDA (Rm) 22 837 (1.1) Active customers (‘000) 32 115 1.9 Active data customers (‘000) (excl M2M) 16 595 9.4 Active data customers (‘000) (incl M2M) 18 267 9.9 Smart devices (‘000) 11 588 29.7 Key indicators 7 7 International: Delivering strong data growth Key indicators 2015 % change Revenue (Rm) 15 747 9.7 (4.0*) Service revenue (Rm) 15 291 10.0 (4.5*) 4 104 -3.6% (-7.6*) 29 533 13.7 Active data customers (‘000) (excl M2M) 9 878 28.7 Active data customers (‘000) (incl M2M) 9 971 29.2 Active m-pesa customers (‘000) 7 991 34.2 EBITDA (Rm) Active customers (‘000) • #1 in all markets on revenue and customer market share • +5.9% EBITDA growth (excl one-off write down of current assets) • +32.9% data revenue growth offset competition in voice growth • +27.5% m-pesa revenue growth * Normalised growth adjusted for trading foreign exchange and at a constant currency 8 (using current year as base) 8 4 15/05/2015 Strategic review 9 Strategic pillars GROWTH REPUTATION Diversify revenue to deliver growth CUSTOMER Grow data Grow new services Grow international Grow enterprise Clear NPS leadership Best network experience Best value Best service OPERATIONS Transform society and build stakeholder trust PEOPLE Positive impact Maintaining leadership Best talent, best practice Enhancing diversity Developing skills Growing talent Deliver cost and process efficiency Structural savings Process simplification Multi-year initiatives 10 10 5 om N m 15/05/2015 SA customer: “Best Network” promise for our customers Delivering on our promise of…. Fastest and widest coverage Network performance and quality +1684 LTE +1554 3G sites added #1 in drive testing Widest coverage 3G & 4G 3G population coverage 4G population coverage 96% 87% Best for video and smartphones #1 in mobile network NPS Best call quality rates Fastest speeds Source: Atio (March 2015) Source: Ookla results (March 2015) (Mbps) 79% 35% 63% 14% 11% 2% 0.7 Estimated population coverage 1.3 2.0 2.3 15.5 9.2 Call drop rates 8.5 3.9 Download speeds Vodacom SA Operator A Operator B Operator C 11 SA customer: Delivering “Best Value” to our customers Reducing communication costs Blended ppm Driving pricing transformation Prepaid ppm Stimulating bundle adoption Number of voice bundles sold (m) 73% 1.00 0.79 0.65 17.7% 0.72 0.55 2013 2014 0.45 55% Contract customers on integrated tariffs Top up >> customers >> on new price plans 2015 • +12.5% in outgoing voice traffic • -24.1% in data price per MB • +63.1% in data traffic 18.2% 78% 333 576 2014 2015 • CVM delivering deeper customer understanding • Average of 53m prepaid voice bundles sold pm in Q4 • Reduced contract churn from 11.8% to 9.2% • 69.3% contract revenue in bundle 12 6 15/05/2015 SA customer: “Best service” - rated #1 in NPS In store Online… Customer care • Perfect startup • +52% My Vodacom App users • 79% First call resolution • Launched Vodacom RED Box • 2.4m App downloads • 64% Touchpoint NPS • Voice Biometrics launched in Q3 • 43% (IVR) self service +18% 64% New store format Customer footfall uplift +80 new store formats added • 15% reduction in calls 13 50% 50% 45% 42% 8.8 SA7.1growth: supporting the data boom 42% Data strategy 11.3 45% 40% 8.8 40% 11.3 35% 35% 32% 2013 Non smart Smart % active smart data devices 7.5 43% 8.9 32% 2G to 3G 11.6 28% 19.3 18.6 15.4 2013 2014 2015 • +3 million entry smart devices sold • Kicka <R550: 640k sold • Timon <R1000; 450k sold +12.6% Driving usage Bundle adoption Number of data bundles sold (m) +10.8% ARPU uplift 26% 19.7 30% 30% 26% Increased 25% coverage Access to better devices 19.7 18.8 25% 15.7 20% 18.8 15.7 Active devices (m) 2013 2014 20% 2015 2014 2015 Smart Non smart % active smart data devices 3G to 4G • R8.6bn capital spent • 3G +21.4% to 8 802 sites • 4G +183.8% to 2600 sites 139% 82 196 2014 2015 • 90% of data traffic inbundle • Average of 20 million data bundles sold pm in Q4 1.3m active sessions 32% ARPU uplift 7.1 • +63.1% in data traffic • Deezer driving increased usage 14 7 15/05/2015 SA growth: Fuelling new services m-pesa: revamped Insurance Machine to Machine Insurance revenue (‘000) Number of connections (‘000) 36.0% • >10k outlets 324,585 441,397 1,159 1,443 1,672 2014 2015 2013 2014 2015 • Offering life, funeral, contract and other insurance cover • Improved ecosystem 15.9% • Airtime incentives • +26.1%* M2M revenue growth • XLink providing platform to grow in verticals and capture internet of things * Represents revenue growth normalised for XLink 15 Growth: Enterprise – maintained NPS lead Fixed & Managed services revenue Enterprise contribution (R million) International 8.8%* Future growth areas M2M SA R11.1bn* 17.9%* of Group service revenue • +9.7%* in customers FTTB & Enterprise connectivity SMEs 1 145 1,327 789 Africa expansion 927 1,251 1,403 2013 2014 2015 • Enterprise churn down 1.3ppt to 7.8% • Fixed and managed services revenue up 14% • 11.1% growth in SME revenue • Ability to sell throughout Africa Converged Cloud, Hosting, IT Underpinned by our: • Extensive IP and 4G network, Brand, Customer experience, Innovation and Security Offering * Excluding Nashua 16 8 15/05/2015 International growth: Strong and increasing contribution Service revenue Active customers Data revenue 10.0% (‘000) TZN 32.9% R15.3bn DRC MOZ LES R3.0bn 24.6% of Group service revenue 19.9% of International service revenue • Contribution up from 22.4% to 24.6% of Group service revenue 1,268 1,344 • Contribution up from 16.5% to 19.9% of International service revenue 4,877 1,108 3,045 4,333 7,706 10,008 9,468 10,284 12,172 2013 2014 2015 11,216 • Active customers up 13.7% • Active customers now 47.9% of Group 17 International: Driving growth through… Increasing data penetration 28.7% (‘000) Expanding coverage 2G Increasing MPESA penetration 3G (‘000) Developing enterprise 34.2% Malaysia Tunisia UK France Algeria 3 047 Mali Singapore Niger Senegal Liberia Benin Cote D’Ivoire Sudan Chad Burkina Faso Guinea S. Leone Ghana 2 025 Egypt Libya Mauritania 50.5% Djibouti Nigeria Ethiopia CAR Togo Kenya Gabon Congo (DRC) Rwanda Burundi Tanzania 4,117 2013 7,675 • +28.7% in data customers • +185.8% in data traffic 2014 Sites 2015 Namibia Zambia Zimbabwe Botswana 4 896 2013 5 953 7 991 2014 2015 MPESA customers • Incr ultra low cost sites • Expanding agents • R4 654m capital spend • Growing ecosystem • 29.6% capital intensity • +27.5% in m-pesa revenue Malawi Angola 29.4% 9,878 2014 2015 Data customers Seychelles 5 569 4 304 Mauritius Swaziland MPLS Network Lesotho South Africa Reachable through VSAT & Partners • Roll out of enterprise in key markets • Drive hosting, cloud and IT security services 18 9 15/05/2015 People: Attracting and retaining the best talent Driving people transformation through Diversity Acquiring new skills Growing talent Yolanda Cuba Howard Lee Godfrey Motsa Chief officer: Strategy and Business Development 2014 Graduate permanently placed in HR Chief Officer CBU Part of international assignee programme and succession programme • Increasing women representation • Female leaders in waiting • 74% black and 44% female staff • R131m spent on skills development • 77 grads in 2015 Graduate programme • Import new skills from Vodafone • 67% of exco black and 17% female • International assignee programme • Recognition initiatives • Capability build and succession programmes 19 Reputation: Mobiles for Good Vodacom R80m spent by Vodacom Foundation in SA Lesotho: Moyo Lesedi 40k kids to be treated for HIV by +225k 2017 TZN subscribers: Healthy pregnancy: Healthy baby 61 ICT centres in SA: +R52m invested in ICT projects on education and health eSchool free education portal TZN Women Ambassador 20 volunteers for Change the World +3000 Vodacom Women Ambassadors 20 20 10 15/05/2015 Financial review 2015 Did you know? Vodacom e-school initiative won a Frost & Sullivan Award for SA e-Education Technology Innovation Leadership 21 Group income statement R million 2015 2014 % change Revenue 77 333 75 711 2.1 % change* 1.1 Service revenue 62 167 62 047 0.2 (1.0) EBITDA 26 905 27 314 (1.5) (1.1) Operating profit 19 235 20 394 (5.7) (7.7) Net finance charges (1 384) (809) 71.1 Profit before tax 17 851 19 585 (8.9) Taxation (5 341) (5 918) (9.7) Net profit 12 510 13 667 (8.5) 12 672 13 243 (4.3) (162) 424 (138.2) 860 896 (4.0) 1 466 1 466 Attributable to: Equity shareholders Non-controlling interests HEPS (cents) Weighted average shares in issue (million) * Normalised growth adjusted for trading foreign exchange and at a constant currency (using current year as base) 22 11 15/05/2015 Group service revenue Group service revenue normalised growth by category R million 0.2% (1.0*) 735 217 (1 756) (2 083) 62 047 2014 service revenue (225) 3 232 Mobile messaging* Mobile data* 62 782 Translation FX 2014 service revenue* 62 167 Mobile interconnect* Mobile voice* Other service revenue* 2015 service revenue * Adjusted for trading foreign exchange and at a constant currency (using current year as base) 23 Positive underlying growth in a tough environment SA service revenue R47 032m International service revenue R15 291m R million/% R million/% 3.7% 2.0% 2.0% -0.6% -2.0% -1.7% 17.3% 9.5% -2.0% 7.6% 7.8% -5.8% 3.6% 7.2% 5.2% 1.9% 11 442 11 995 11 856 11 739 3 493 3 873 3 975 3 950 Q1 2015 Q2 2015 Q3 2015 Q4 2015 Q1 2015 Q2 2015 Q3 2015 Q4 2015 Service revenue Underlying growth# Reported growth Service revenue # Underlying growth • Trends improved during Q4 • Accelerated network roll out • Strong data growth maintained • Strong data growth maintained Reported growth • 1.5% FY2015 growth excluding MTR cuts # Underlying growth adjusted for MTR impact (only in SA) and at constant currency (only in International) 24 12 15/05/2015 Cost management in a tough environment SA opex as % of service revenue % International opex as % of service revenue % 23.5% 22.3% 21.9% 38.9% 37.1% 22.7% 35.7% 36.2% 2013 2014 2013 2015 Opex to service revenue** Opex to service revenue excluding MTR impact and SA One-Off 2014 2015 Opex to service revenue ** Opex to service revenue excluding International One-Off • Excluding the impact of foreign exchange, total expenses increased by 1.0% • Excluding the International One-Off total expenses increased 4.1%* below service revenue growth of 4.5%* • Tight cost management continued with a structured cost savings programme • Increased network costs as network expands * Adjusted for trading foreign exchange and at a constant currency (using current year as base) ** Represents opex excluding trading foreign exchange from ongoing operations 25 Group EBITDA impacted by MTRs Group EBITDA R million (1.5%*) (174) 73 (340) (1 215) 27 314 2014 EBITDA (3) 1 250 27 387 Trading and 2014 EBITDA* translation forex 26 905 Trading forex MTR impact South Africa International EBITDA excl MTR EBITDA* and trading forex Other 2015 EBITDA * Adjusted for trading foreign exchange and at a constant currency (using current year as base) 26 13 15/05/2015 Underlying EBITDA margins flat in a tough environment SA EBITDA International EBITDA R million/% R million/% 38.2% 29.6% 37.4% 29.0% 37.4% 23.6% 36.8% 26.1% 22 408 23 087 22 837 2 739 4 256 2013 2014 2015 2013 2014 EBITDA Reported margin Underlying margin^ • Margins impacted by MTRs EBITDA Reported margin 4 104 2015 Underlying margin^ • Margins impacted by write down of current assets • Underlying margin flat yoy • Underlying margins largely flat yoy ^ Underlying EBITDA margin adjusted for MTRs, SA One-Off (South Africa only) and trading foreign exchange and International One-Off (International only) 27 Adequate debt capacity Group net debt Group net finance charges R million Net finance costs 2015 2014 R million 2015 2014 (1 391) (718) Bank and cash balances 9 250 6 127 Bank overdrafts (380) (335) Borrowings and net derivative financial instruments (25 630) (13 844) Net debt (16 760) (8 052) 0.6 0.3 (20 837) (14 313) Remeasurement of loans (18) 169 (Loss)/gain on remeasurement (15) 29 40 (289) (1 384) (809) 7.1 6.7 Gain/(loss) on derivatives¥ Net finance charges Average cost of debt (%) ¥ Mainly revaluation of foreign currency exchange contracts Net debt/EBITDA (times) Average debt 28 14 15/05/2015 Group effective tax rate remains stable Group tax Group tax reconciliation R million R million 2015 Profit before tax Normal tax 30.2% 29.9% 28.3% 4 998 28.0 Non-deductible interest expenditure 165 0.9 Withholding tax 141 0.8 37 0.2 5 341 29.9 Other 5,210 5,918 5,341 2013 2014 2015 Tax expense Rate (%) 17 851 Total tax expense/effective tax rate Effective tax rate 29 Headline earnings per share 2014 headline earnings per share 2015 headline earnings per share Cents per share Cents per share BBBEE adjusted HEPS 917 HEPS excl MTR BBBEE charge (21) MTR (60) HEPS 860 Other 4 EPS 864 HEPS Other EPS 896 7 903 920 30 15 15/05/2015 Group statement of financial position R million 2015 2014 Movement 35 959 30 802 5 157 7 603 5 369 2 234 Assets Property, plant and equipment Intangible assets Other non-current assets 2 392 1 783 609 Current assets 25 353 22 787 2 566 Total assets 71 307 60 741 10 566 Total equity 21 643 23 743 (2 100) Borrowings 25 659 13 750 11 909 Other liabilities 24 005 23 248 757 Total equity and liabilities 71 307 60 741 10 566 Net asset value 21 643 23 743 (2 100) Equity and liabilities 31 Good progress with accelerated capex program Group capital expenditure SA capex breakdown R million 13 305 ф 9 456 10 779 Properties & Shops 6% ф 4 654 ф IT 17% Radio Access Network 41% 3 919 17.2% 2 864 Other 2% 14.2% 13.5% 6 967 2013 SA 6 858 8 646 2014 International 2015 Group capital intensity Intelligent Networks 8% Core 6% Transmission 20% Ф Total includes corporate and eliminations 32 16 15/05/2015 Group free cash flow impacted by MTRs and increased capex Group free cash flow R million (707) (41.1%) (12 195) (1 152) (4 979) 26 905 2015 EBITDA 1. 2. 26 198 ( 109) 14 003 Working capital Cash & other 1 generated from operations Cash capital expenditure 2 Operating free cash flow 7 763 Net finance costs paid Tax paid Net dividends received & dividends paid to minority shareholders 2015 free cash flow Working capital Includes R511m favourable cashflow movement due to an increase in amounts due to m-pesa account holders Cash capital expenditure comprises the purchase of property, plant and equipment and intangible assets, other than license and spectrum payments, net of cash flow from disposals 33 Dividend policy unchanged Dividend per share Cents per share • Final dividend declared of 400 cents per share 825 775 430 400 395 375 2014 Interim dividend • Pay-out ratio of at least 90% of HEPS maintained 2015 Final dividend 34 17 15/05/2015 Group medium-term guidance Mid single digit Low single digit EBITDA growth Service revenue growth 3 year guidance Between 14% and 17% of Group revenue Capital expenditure 35 Priorities for the year ahead 2015 Did you know? Vodacom achieved best performer in the JSE’s Socially Responsible Investment Index 3 times in 4 years 36 18 15/05/2015 Medium-term priorities Clear market share leadership in all markets through segmented offerings and best distribution Grow NPS and brand leadership through sustained network leadership, differentiated customer experience and best value 5 point consistent lead Grow contribution from new services to 5% of service revenue Grow data revenue to 40% of service revenue Grow fixed line in SA by accelerating FTTx connections Grow enterprise share in all markets. 30% of service revenue Grow contribution of non–SA entities to 30% of service revenue Drive cost efficiencies in each of our core mobile businesses to ensure cost growth of 0.5% lower (0.5 ppt delta) than revenue growth Drive people transformation through diversity, acquiring new skills and growing talent Engagement score of 80 Proactive engagement with government and stakeholders to ensure achievement of each country’s broadband goals and contribute to initiatives which make a positive impact on societies Clear reputation leadership among telcos in all markets 37 37 Thank you 2015 Did you know? Vodacom was rated 1st in telecoms sector and 3rd overall in 2014 Top Companies Reputation Index 38 19 15/05/2015 Country data South Africa Tanzania DRC Mozambique Lesotho 54 52 71 27 2 7 030 752 494 677 1 190 2.2 7 8.3 7.2 5.2 153 64 41 41 75 100ᴥ 82.2 51 85 80 2029 2031 2018/2032µ 2018/2026µ 2016 32 115 12 172 11 216 4 877 1 268 Population (million) GDP per capita± (USD) GDP growth estimate± 2014 (%) Estimated mobile penetration (%) Ownership (%) License expiry period Active customers (thousand) ARPU (rand per month) ARPU (local currency per month) 113 42 32 52 53 R113 TZS6 530 USD2.9 MZN149 LSL53 126 149 41 113 59 Minutes of use per month ± The Economist Intelligence Unit µ 2018 relates to the 2G license and 2026 /2032 relates to the 3G license ᴥ 6.25% held indirectly through special purpose entities which are consolidated in terms of SIC 12: Consolidation – Special Purpose Entities as part of the broad-based 39 black economic empowerment transaction 39 Impact of foreign exchange Average exchange rates Revenue YoY % growth Reported Normalised* 2015 2014 South Africa 0.4 0.4 USD/ZAR 11.07 10.13 9.3 International 9.7 4.0 ZAR/MZN 2.89 3.01 (4.0) Group 2.1 1.1 ZAR/TZS 154.72 160.44 (3.6) EUR/ZAR 13.99 13.59 2.9 2015 EBITDA Operating profit YoY % growth YoY % growth 2015 Reported Normalised* 2015 Reported % change Normalised* South Africa (1.1) 0.2 South Africa (3.0) (1.4) International (3.6) (7.6) International (27.7) (45.3) Group (1.5) (1.1) Group (5.7) (7.7) * Adjusted for trading foreign exchange and at a constant currency (using current year as base) 40 20 15/05/2015 Definitions Active customers Active customers are based on the total number of mobile customers using any service during the last three months. This includes customers paying a monthly fee that entitles them to use the service even if they do not actually use the service and those customers who are active whilst roami ng. Active data customers Number of unique customers who have generated revenue related to any data activities in relation to mobile data revenue (this excludes SMS and MMS messaging users) in the reported month. A user is defined as being active if they are paying for a contractual monthly fee for this service or ha ve used the service during the reported period. ARPU Total ARPU is calculated by dividing the average monthly service revenue by the average monthly active customers during the period. Contribution margin Revenue less direct expenses as a percentage of revenue. EBITDA Earnings before interest, taxation, depreciation and amortisation, impairment losses, profit/loss on disposal of investments, property, plant and equipment, and intangible assets, profit/loss from associate and joint venture, restructuring cost and BBBEE income/charge. Free cash flow Cash generated from operations less additions to property, plant and equipment and intangible assets, proceeds on disposal of property, plant and equipment and intangible assets, tax paid, net finance charges paid and net dividends received/paid to minority shareholders. HEPS Headline earnings per share. International International comprises the segment information relating to the non-South African-based cellular networks in Tanzania, the Democratic Republic of Congo, Mozambique and Lesotho as well as the operations of Vodacom International Limited, Vodacom Business Africa and Gateway Carrier Services. MOU Minutes of use per month is calculated by dividing the average monthly minutes (traffic) during the period by the average monthly active customers during the period. Normalised (*) Adjusted for trading foreign exchange and at a constant currency (using current year as base) from ongoing operations. Operating free cash flow Cash generated from operations less additions to property, plant and equipment and intangible assets other than licence and spectrum payments and purchases of customer bases, net of proceeds on disposal of property, plant and equipment and intangible assets, other than license and spectrum payments and disposals of customer bases. RAN Radio access network. South Africa Vodacom (Pty) Limited, a private limited liability company duly incorporated in accordance with the laws of South Africa and its subsidiaries, joint ventures and SPV’s. TSR Total shareholder returns consist of the aggregate share price appreciation and dividend yield. Traffic Traffic comprises total traffic registered on Vodacom’s mobile network, including bundled minutes, promotional minutes and outgoing international roaming calls, but excluding national roaming calls, incoming international roaming calls and calls to free services. 41 Forward-looking statements This presentation which sets out the annual results for Vodacom Group Limited for the year ended 31 March 2015 contains 'forward-looking statements‘, which have not been reviewed or reported on by the Group’s auditors, with respect to the Group’s financial condition, results of operations and businesses and certain of the Group’s plans and objectives. In particular, such forward-looking statements include statements relating to: the Group’s future performance; future capital expenditures, acquisitions, divestitures, expenses, revenues, financial conditions, dividend policy, and future prospects; business and management strategies relating to the expansion and growth of the Group; the effects of regulation of the Group’s businesses by governments in the countries in which it operates; the Group’s expectations as to the launch and roll out dates for products, services or technologies; expectations regarding the operating environment and market conditions; growth in customers and usage; and the rate of dividend growth by the Group. Forward-looking statements are sometimes, but not always, identified by their use of a date in the future or such words as ‘will’, ‘anticipates’, ‘aims’, ‘could’, ‘may’, ‘should’, ‘expects’, ‘believes’, ‘intends’, ‘plans’ or ‘targets’. By their nature, forward-looking statements are inherently predictive, speculative and involve risk and uncertainty because they relate to events and depend on circumstances that will occur in the future, involve known and unknown risks, uncertainties and other facts or factors which may cause the actual results, performance or achievements of the Group, or its industry to be materially different from any results, performance or achievement expressed or implied by such forward-looking statements. Forward-looking statements are not guarantees of future performance and are based on assumptions regarding the Group’s present and future business strategies and the environments in which it operates now and in the future. All subsequent oral or written forward-looking statements attributable to the Group or any member thereof or any persons acting on their behalf are expressly qualified in their entirety by the cautionary statements above and below. Vodacom expressly disclaims any liability in respect of the content of any forward looking statement and also expressly disclaims any obligation or undertaking to disseminate any updates or revisions to any forward-looking statements contained herein or to reflect any change in their expectations with regard thereto or any change in events, conditions or circumstances on which any such forward-looking statement is based. 42 21 15/05/2015 www.vodacom.com investorrelations@vodacom.co.za +27 11 653 5055 facebook.com/vodacom @vodacom Results for the year ended 31 March 2015 22
