Document
advertisement
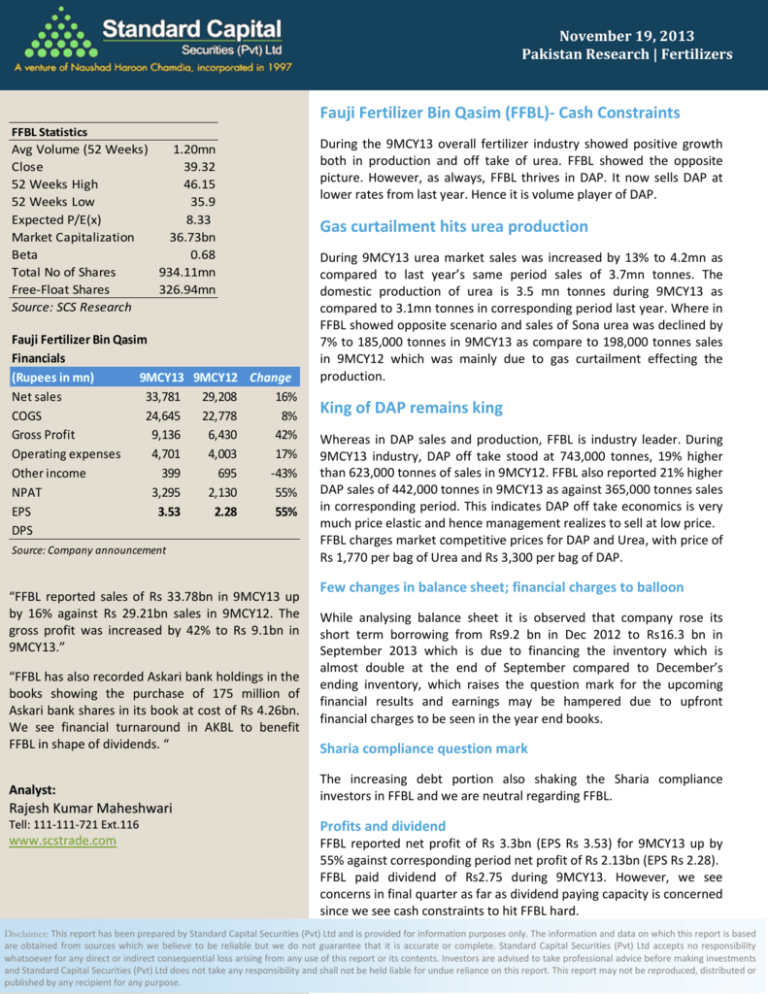
October November 03,19, 2013 2013 Pakistan Pakistan Research Research | Fertilizers | Fertilizers Fauji Fertilizer Bin Qasim (FFBL)- Cash Constraints FFBL Statistics Avg Volume (52 Weeks) 1.20mn Close 39.32 52 Weeks High 46.15 52 Weeks Low 35.9 Expected P/E(x) 8.33 Market Capitalization 36.73bn Beta 0.68 Total No of Shares 934.11mn Free-Float Shares 326.94mn Source: SCS Research Fauji Fertilizer Bin Qasim Financials (Rupees in mn) 9MCY13 9MCY12 Change Net sales 33,781 29,208 16% COGS 24,645 22,778 8% Gross Profit 9,136 6,430 42% Operating expenses 4,701 4,003 17% Other income 399 695 -43% NPAT 3,295 2,130 55% EPS 3.53 2.28 55% DPS Source: Company announcement “FFBL reported sales of Rs 33.78bn in 9MCY13 up by 16% against Rs 29.21bn sales in 9MCY12. The gross profit was increased by 42% to Rs 9.1bn in 9MCY13.” “FFBL has also recorded Askari bank holdings in the books showing the purchase of 175 million of Askari bank shares in its book at cost of Rs 4.26bn. We see financial turnaround in AKBL to benefit FFBL in shape of dividends. “ Analyst: Rajesh Kumar Maheshwari During the 9MCY13 overall fertilizer industry showed positive growth both in production and off take of urea. FFBL showed the opposite picture. However, as always, FFBL thrives in DAP. It now sells DAP at lower rates from last year. Hence it is volume player of DAP. Gas curtailment hits urea production During 9MCY13 urea market sales was increased by 13% to 4.2mn as compared to last year’s same period sales of 3.7mn tonnes. The domestic production of urea is 3.5 mn tonnes during 9MCY13 as compared to 3.1mn tonnes in corresponding period last year. Where in FFBL showed opposite scenario and sales of Sona urea was declined by 7% to 185,000 tonnes in 9MCY13 as compare to 198,000 tonnes sales in 9MCY12 which was mainly due to gas curtailment effecting the production. King of DAP remains king Whereas in DAP sales and production, FFBL is industry leader. During 9MCY13 industry, DAP off take stood at 743,000 tonnes, 19% higher than 623,000 tonnes of sales in 9MCY12. FFBL also reported 21% higher DAP sales of 442,000 tonnes in 9MCY13 as against 365,000 tonnes sales in corresponding period. This indicates DAP off take economics is very much price elastic and hence management realizes to sell at low price. FFBL charges market competitive prices for DAP and Urea, with price of Rs 1,770 per bag of Urea and Rs 3,300 per bag of DAP. Few changes in balance sheet; financial charges to balloon While analysing balance sheet it is observed that company rose its short term borrowing from Rs9.2 bn in Dec 2012 to Rs16.3 bn in September 2013 which is due to financing the inventory which is almost double at the end of September compared to December’s ending inventory, which raises the question mark for the upcoming financial results and earnings may be hampered due to upfront financial charges to be seen in the year end books. Sharia compliance question mark The increasing debt portion also shaking the Sharia compliance investors in FFBL and we are neutral regarding FFBL. Tell: 111-111-721 Ext.116 Profits and dividend www.scstrade.com FFBL reported net profit of Rs 3.3bn (EPS Rs 3.53) for 9MCY13 up by 55% against corresponding period net profit of Rs 2.13bn (EPS Rs 2.28). FFBL paid dividend of Rs2.75 during 9MCY13. However, we see concerns in final quarter as far as dividend paying capacity is concerned since we see cash constraints to hit FFBL hard. Disclaimer: This report has been prepared by Standard Capital Securities (Pvt) Ltd and is provided for information purposes only. The information and data on which this report is based are obtained from sources which we believe to be reliable but we do not guarantee that it is accurate or complete. Standard Capital Securities (Pvt) Ltd accepts no responsibility whatsoever for any direct or indirect consequential loss arising from any use of this report or its contents. Investors are advised to take professional advice before making investments and Standard Capital Securities (Pvt) Ltd does not take any responsibility and shall not be held liable for undue reliance on this report. This report may not be reproduced, distributed or published by any recipient for any purpose.
