daily call (28-01
advertisement
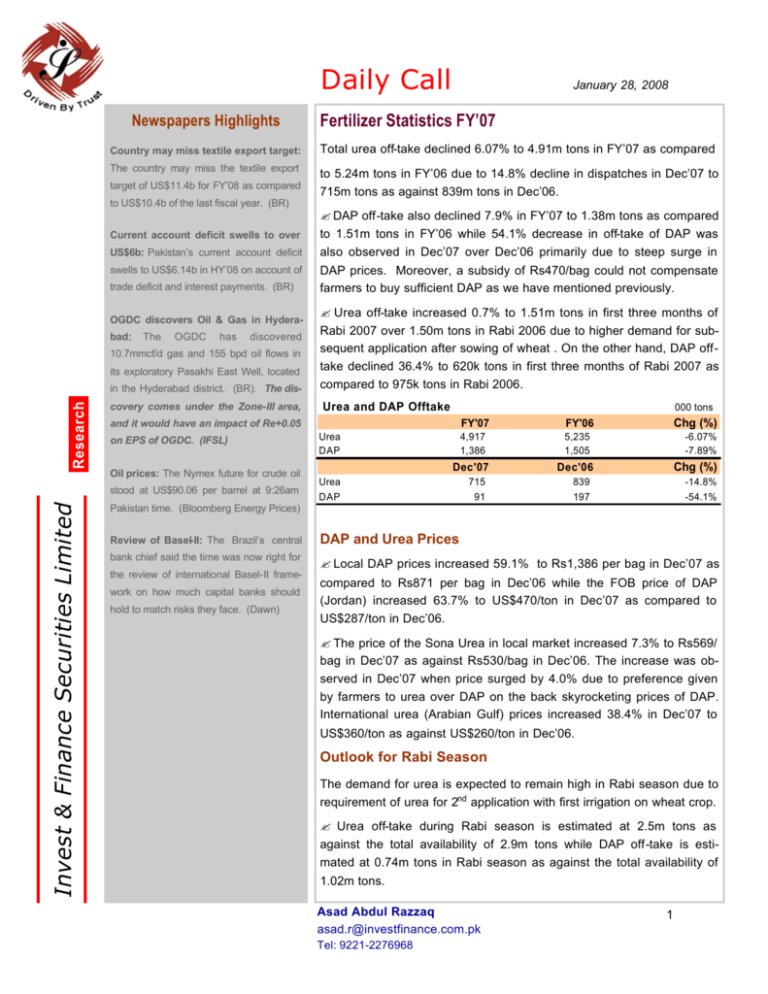
Daily Call Newspapers Highlights January 28, 2008 Fertilizer Statistics FY’07 Country may miss textile export target: Total urea off-take declined 6.07% to 4.91m tons in FY’07 as compared The country may miss the textile export to 5.24m tons in FY’06 due to 14.8% decline in dispatches in Dec’07 to 715m tons as against 839m tons in Dec’06. target of US$11.4b for FY’08 as compared to US$10.4b of the last fiscal year. (BR) Current account deficit swells to over US$6b: Pakistan’s current account deficit swells to US$6.14b in HY’08 on account of trade deficit and interest payments. (BR) in the Hyderabad district. (BR). The discovery comes under the Zone-III area, Urea and DAP Offtake bad: The OGDC has discovered 10.7mmcf/d gas and 155 bpd oil flows in its exploratory Pasakhi East Well, located Research DAP prices. Moreover, a subsidy of Rs470/bag could not compensate farmers to buy sufficient DAP as we have mentioned previously. ? Urea off-take increased 0.7% to 1.51m tons in first three months of Rabi 2007 over 1.50m tons in Rabi 2006 due to higher demand for subsequent application after sowing of wheat . On the other hand, DAP offtake declined 36.4% to 620k tons in first three months of Rabi 2007 as compared to 975k tons in Rabi 2006. OGDC discovers Oil & Gas in Hydera- 000 tons FY'07 FY'06 4,917 1,386 5,235 1,505 Dec'07 Dec'06 and it would have an impact of Re+0.05 on EPS of OGDC. (IFSL) Oil prices: The Nymex future for crude oil stood at US$90.06 per barrel at 9:26am Invest & Finance Securities Limited ? DAP off-take also declined 7.9% in FY’07 to 1.38m tons as compared to 1.51m tons in FY’06 while 54.1% decrease in off-take of DAP was also observed in Dec’07 over Dec’06 primarily due to steep surge in Urea DAP Urea DAP 715 91 Chg (%) -6.07% -7.89% Chg (%) 839 197 -14.8% -54.1% Pakistan time. (Bloomberg Energy Prices) Review of Basel- II: The Brazil’s central DAP and Urea Prices bank chief said the time was now right for ? Local DAP prices increased 59.1% to Rs1,386 per bag in Dec’07 as the review of international Basel-II framework on how much capital banks should hold to match risks they face. (Dawn) compared to Rs871 per bag in Dec’06 while the FOB price of DAP (Jordan) increased 63.7% to US$470/ton in Dec’07 as compared to US$287/ton in Dec’06. ? The price of the Sona Urea in local market increased 7.3% to Rs569/ bag in Dec’07 as against Rs530/bag in Dec’06. The increase was observed in Dec’07 when price surged by 4.0% due to preference given by farmers to urea over DAP on the back skyrocketing prices of DAP. International urea (Arabian Gulf) prices increased 38.4% in Dec’07 to US$360/ton as against US$260/ton in Dec’06. Outlook for Rabi Season The demand for urea is expected to remain high in Rabi season due to requirement of urea for 2nd application with first irrigation on wheat crop. ? Urea off-take during Rabi season is estimated at 2.5m tons as against the total availability of 2.9m tons while DAP off-take is estimated at 0.74m tons in Rabi season as against the total availability of 1.02m tons. Asad Abdul Razzaq asad.r@investfinance.com.pk Tel: 9221-2276968 1 Market Statistics KSE Statistics Market Capt. US$68.12b KSE-100 Index 25-Jan-08 Rs4252.20b 12 m 13,856.4 Amount (Rs b) Last Closing 13,719.2 Volume (m) 48.3 557.3 137.2 Average Rate 1.0% 12 mths Chg % 1.4% 10.8% 4.2b, 10.7% 12 mths Low 10,899.7 PPL 4.0b, 10.7% Trading Volume Ready Futures 251.7 Open Int. (Rs b) Futures Total 2.7b, 10.7% 11.93 Last Day Open Int. (Rs b) 251.7 Open Int. (m sh.) 11.53 96.75 YTD Average 248.9 Top Gainers Top Losers 12 mths Average 264.1 ENTL ( + 5.0%) AHL (- 3.8%) PACE (+ 4.9%) DSFL (- 2.7%) 12 mths High 524.6 TRG ( + 4.8%) SPL (- 2.4%) 12 mths Low 59.1 NIB ( + 4.3%) DSL (- 2.3%) Global Markets Index Origin DOW JONES New York NIKKIE-225 Tokyo DAX Frankfurt FTSE-100 London CAC-40 Paris SSEC Shanghai SMSI Madrid SENSEX Mumbai KS11 Seoul IPC Mexico AORD Sydney BVSP São Paulo RTS Moscow OXMS Stockholm Hang Seng Hong Kong Strait Times Singapore KLSE Kuala Lumpur MERVAL Buenos Aires CCSI Cairo (91.65) 978.23 Top Inflows USA 10.43% 10.95% 3 years PIB 9.87% 5.2b, 10.8% 14,814.9 POL 12,983.8 OGDC 10.55% 12 months Kibor 12 mths High 12 mths Average YTD Flow 9.85% 10.33% FY'07 Flow 6 months Kibor 10.01% 6.5b, 10.8% AHSL Jan'07 3 months Kibor Amount (b), Rate 25.6% NBP SCRA Position (m US$) Current Top 5 CFS Stocks (last day) YTD Chg % Interest Rates Continuous Funding System Current Closing Chg Chg % 41.0% Other Domestic Market Indicators 9.30% 240.01 Kuwait 44.84 Luxembourg 11.58 Camyan Island 6.10 5 years PIB 10.15% 9.70% 10 years PIB 10.65% 10.20% Exchange Rates Jan'07 Current Chg % US Dollar 62.42 2.53% 60.88 Top Outflows UK 218.33 Australia 47.84 Important Board Meetings Arif Habib Ltd 28-Jan-08 Honda Atlas Cars 28-Jan-08 Dawood Hercules 28-Jan-08 Euro 91.90 Fauji Fertilizer Company31-Jan-08 79.51 15.58% Unilever Pakistan 12-Feb-08 Yen 0.58 Shell Pakistan 13.73% Packages Ltd 12-Feb-08 0.51 Yuan 8.67 Kot Addu Power 10.59% Packages Ltd 14-Feb-08 7.84 14-Feb-08 14-Feb-08 Commodities Current 4,107.9 13,629.2 6,816.7 5,869.0 4,878.1 4,761.7 1,423.4 18,361.7 1,692.4 27,379.9 5,886.3 57,463.0 2,033.1 312.7 25,122.4 3,159.5 1,405.4 1,982.7 3,304.5 Last 12 mths Chg Chg -1.0% -2.5% 4.1% -22.2% -0.1% 2.1% -0.1% -6.4% -0.8% -13.0% 0.9% 65.2% 7.0% -8.5% 6.6% 28.6% 1.8% 22.4% -1.9% 1.8% 5.0% 2.3% 6.0% 28.6% 2.3% 9.2% 0.7% -19.2% 6.7% 21.5% 3.6% 5.0% 1.6% 20.2% 0.8% -3.0% 3.5% 39.6% Index Origin Gold London Silver London Copper London Oil OPEC Basket Natural Gas Nymex Coal South Africa Wheat India Sugar India Cotton Karachi Urea Black Sea Current 921.25 1,653.00 7,119.00 84.58 7.98 97.17 1,108.40 1,375.00 3,200.00 365.00 Last 12 mths Chg Chg 3.3% 1.1% 0.4% -0.1% 4.8% -3.6% 0.2% 0.1% 0.0% -3.4% 42.0% 23.5% 22.2% 66.4% 38.6% 94.4% -5.5% -16.1% 25.5% 30.8% Invest & Finance Securities Limited 12th Floor, Corporate Towers, Technocity Building, Hasrat Mohani Road, Off. I.I. Chundrigar Road. Karachi. Tel: 9221- 2276932-35 Fax: 9221- 2276969 website: www.investfinance.com.pk 2 Disclaimer: This report is for information purposes only and we are not soliciting any action based upon it. The material is based on information we believe to be reliable but we do not guarantee that it is accurate and complete. Invest & Finance Securities Ltd. will not be responsible for the consequence of reliance upon any opinion or statement herein or for any omission.
