Exercises, Epidemiology papers
advertisement
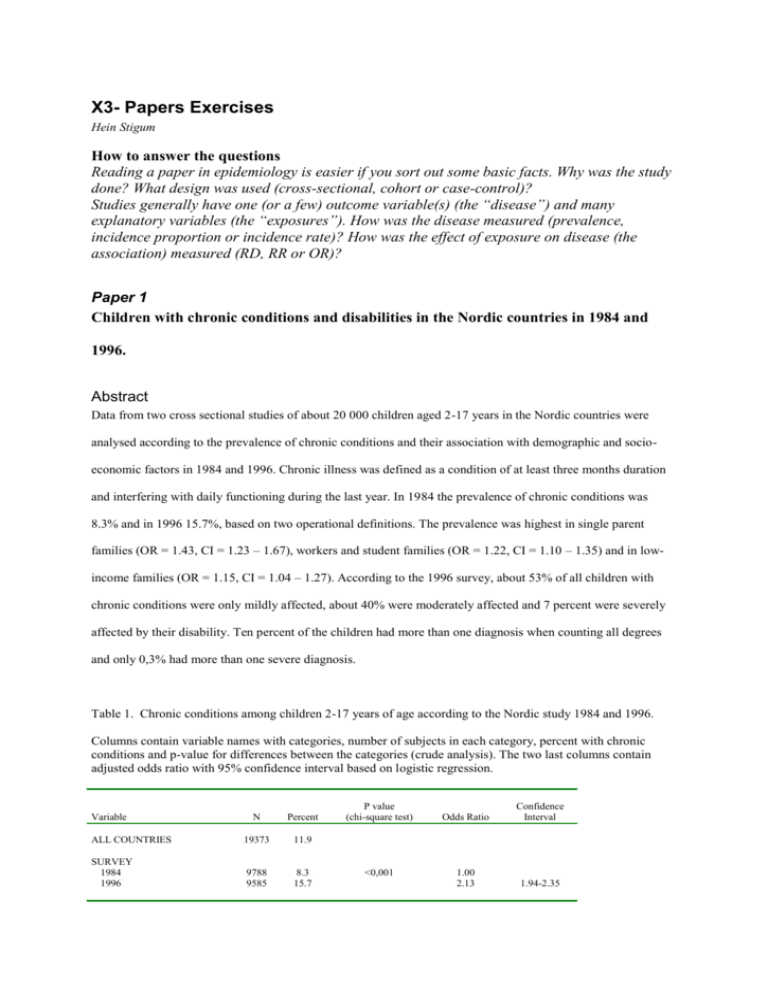
X3- Papers Exercises Hein Stigum How to answer the questions Reading a paper in epidemiology is easier if you sort out some basic facts. Why was the study done? What design was used (cross-sectional, cohort or case-control)? Studies generally have one (or a few) outcome variable(s) (the “disease”) and many explanatory variables (the “exposures”). How was the disease measured (prevalence, incidence proportion or incidence rate)? How was the effect of exposure on disease (the association) measured (RD, RR or OR)? Paper 1 Children with chronic conditions and disabilities in the Nordic countries in 1984 and 1996. Abstract Data from two cross sectional studies of about 20 000 children aged 2-17 years in the Nordic countries were analysed according to the prevalence of chronic conditions and their association with demographic and socioeconomic factors in 1984 and 1996. Chronic illness was defined as a condition of at least three months duration and interfering with daily functioning during the last year. In 1984 the prevalence of chronic conditions was 8.3% and in 1996 15.7%, based on two operational definitions. The prevalence was highest in single parent families (OR = 1.43, CI = 1.23 – 1.67), workers and student families (OR = 1.22, CI = 1.10 – 1.35) and in lowincome families (OR = 1.15, CI = 1.04 – 1.27). According to the 1996 survey, about 53% of all children with chronic conditions were only mildly affected, about 40% were moderately affected and 7 percent were severely affected by their disability. Ten percent of the children had more than one diagnosis when counting all degrees and only 0,3% had more than one severe diagnosis. Table 1. Chronic conditions among children 2-17 years of age according to the Nordic study 1984 and 1996. Columns contain variable names with categories, number of subjects in each category, percent with chronic conditions and p-value for differences between the categories (crude analysis). The two last columns contain adjusted odds ratio with 95% confidence interval based on logistic regression. Variable N Percent ALL COUNTRIES 19373 11.9 SURVEY 1984 1996 9788 9585 8.3 15.7 P value (chi-square test) <0,001 Odds Ratio Confidence Interval 1.00 2.13 1.94-2.35 COUNTRY Sweden Iceland Norway Finland Denmark 3995 3161 3549 4501 4167 10.4 14.6 11.6 13.3 10.2 <0.001 SEX Boys Girls 9810 9459 12.5 11.4 0,017 6552 7214 5502 11.2 11.4 13.6 <0,001 AGE 2-6 years 7-12 years 13-17 years 1 year increase 10 year increase PARENTAL MARITAL STATUS Married/living together Single parent 16849 2252 11.2 16.9 <0,001 LIVING AREA Large town (>100 000) Built-up area (3000 – 100 000) Rural (<3000) 6209 6818 6150 12.0 12.1 11.6 0,588 PARENTAL EDUCATION Both low / missing Woman low, man high Woman high, man low Both high 5553 1688 2241 9891 12.9 12.4 10.4 11.7 0.008 PARENTAL OCCUPATION White collar/self-empl/miss Workers/students 14098 5275 11.2 13.8 <0,001 PARENTAL INCOME High income Low income / missing 10836 8510 10.9 13.2 <0,001 1.00 1.49 1.21 1.42 1.05 1.29-1.72 1.04-1.41 1.23-1.62 0.91-1.21 1.00 0.91 0.83-1.00 1.02 1.01-1.03 1.00 1.42 1.23-1.65 Dropped from the model 1.00 1.18 0.95 1.00 0.99-1.42 0.80-1.13 0.87-1.14 1.00 1.22 1.11-1.36 1.00 1.15 1.04-1.27 1) a) What is the objective (purpose) of this study? b) What type of design is this? How many subjects are included? c) What is the outcome (“disease”)? What type of frequency (disease occurrence) measure is used? d) What is the main exposure (or exposures)? What type of association measure is used? Could others have been calculated? e) Discuss sources of error. f) Explain the main results in words. a) Hva er hensikten med denne studien? b) Hvilket design er brukt? Hvor mange personer er inkludert? c) Hva er utfallsvariabelen (”sykdom”)? Og hva slags frekvensmål (sykdoms forekomstmål) er brukt på denne? d) Hva er hovedeksponeringen (eller eksponeringene)? Hva slags assosiasjonsmål er brukt? Kunne andre assosiasjonsmål vært regnet ut? e) Diskuter feilkilder. f) Forklar hovedresultatet i ord. Paper 2 Human Papilloma Virus and Cervix Cancer The association between human papillomavirus (HPV) and cervix cancer was studied. 103 women with cervical cancer were identified in two gynaecological hospitals. 234 age matched controls were randomly selected from a population registry. All subjects were interviewed about their sexual history and smoking history. All women were tested for presence of HPV. HPV DNA was detected in 34/221 (15.4%) of controls and in 89/98 (90.8%) of cases. The association between cervical cancer and the independent variables are shown below. The table provides crude odds ratios and adjusted odds ratios from logistic regression. 95% confidence intervals are given for both measures. (There is a significant association is the confidence interval does not contain the «null value») Crude Adjusted Odds Confidence Odds Confidence Variable Ratio intervall Ratio intervall HPV neg pos Smoking history never ever Number of partners 1-3 4-9 10+ Oral contraceptive use never ever Parity Null 1+ 1.0 68.0 (28.2 - 164.4) 1.0 73.7 (27.7 - 196.4) 1.0 4.1 (2.3 - 7.3) 1.0 1.5 (0.5 - 4.8) 1.0 5.5 8.2 (2.5 - 12.0) (3.7 - 17.9) 1.0 1.9 5.2 (0.6 - 6.2) (1.4 - 19.4) 1.0 1.6 (0.8 - 3.3) 1.0 1.4 (0.5 - 3.8) 1.0 0.5 (0.4 - 0.8) 1.0 1.8 (0.7 - 4.9) 2) a) What is the objective (purpose) of this study? b) What type of design is this? How many subjects are included? c) What is the outcome (“disease”)? What type of frequency (disease occurrence) measure is used? d) What is the main exposure (or exposures)? What type of association measure is used? Could others have been calculated? e) Discuss sources of error. f) Explain the main results in words. g) h) i) j) a) b) c) d) Comparing crude and adjusted, is there evidence of confounding for any of the variables? Can we, based on the table, tell which variable is causing the confounding? Can we, based on the table, assess if there is interaction in the data? How could a possible interaction between HPV status and smoking history be investigated? Hva er hensikten med denne studien? Hvilket design er brukt? Hvor mange personer er inkludert? Hva er utfallsvariabelen (”sykdom”)?. Og hva slags frekvensmål er brukt på denne? Hva er hovedeksponeringen (eller eksponeringene)? Hva slags assosiasjonsmål er brukt? Kunne andre assosiasjonsmål vært regnet ut? e) Diskuter feilkilder. f) Forklar hovedresultatet i ord. Paper 3 Is delivery by caesarean a risk factor for food allergy? Background: A delayed and abnormal bacterial colonisation of the new-born intestine due to improved hygienic conditions in the western world, has been offered as an explanation for the increase in allergic diseases in the western world. Children delivered by a caesarean section are reported to have a delayed colonisation of the intestines. Further, the use of antibiotics may interfere with the colonisation process. The aim of this study was to examine whether caesarean delivery and the use of antibiotics increased the risk of developing food allergy. Design and analyses: A population-based cohort of 3623 children born in Oslo, Norway was followed from birth until the age of two with questionnaires. At birth and at 6 months intervals the parents completed questionnaires. 2803 families (77.4%) responded to all questionnaires. Information was obtained regarding mode of delivery, maternal use of antibiotics during pregnancy and in infants during the first 6 months of life, pregnancy complications and a number of potential confounders. Both repeatedly parentally reported food reactions (at 12, 18 and 24 months) and objectively confirmed food reactions were chosen as outcome measures. Results: Parentally reported reactions to eggs, fish or nuts, and confirmed reactions to milk or egg, were 3 and 2 fold, respectively, more common among children delivered by a caesarean. This association was not seen for parentally perceived reactions to milk, however. In multivariate analysis, adjusting for maternal education, maternal age, maternal smoking habits, gestational age, birth-weight, pregnancy complications and breastfeeding, caesarean delivery was significantly associated with parentally perceived reactions to egg, fish or nuts (OR =2.8 p=0.01) and to confirmed food reactions (OR 1.9 CI 0.7-5.1). The effect was strongest among allergic mothers. The risk for subsequently reported allergy to egg, fish or nuts, for children delivered by a caesarean whose mothers were allergic compared to vaginally delivered children whose mothers were not allergic was estimated to OR 8.7 Correspondingly, the risk increase for subsequent confirmed reactions to milk or egg was estimated to OR 9.7. Both estimates were highly significant in spite of small numbers. Among mothers not reported to be allergic the association was weaker and not significant in the multivariate analysis. Maternal or infant use of antibiotics were not associated with an increased risk of confirmed food allergy (but associated with parentally reported reactions to milk). Conclusion: The results of this study indicates that children delivered by a caesarean section may be at increased risk of developing food allergy, especially if the mother is allergic. The findings supports the theory that factors interfering with the bacterial colonisation of the intestines may play a role in the development of food allergy. Table 2. Children with repeatedly reported reactions to egg, fish or nuts in a population based cohort of 2803 children, according to caesarean delivery, maternal and infant use of antibiotics, short term breastfeeding, maternal allergy and older siblings, adjusted for pregnancy complications, socioeconomic factors and other potential confounding factors. n 2803 All Caesarean delivery Yes 328 No 2475 Maternal antibiotics Yes 272 No 2531 Child antibiotics first 6 mo Yes 963 No 1796 Breastmilk One month or less 122 Longer than 1 month2615 Maternal allergy Yes 571 No 2227 Older siblings Yes 1063 No 1740 % 1.1 p Crude OR (CI) Adjusted OR (CI) 0.003 2.7 0.9 3.1 1 (1.4-6.9) * 3.0 1 (1.3-7.1) * 0.6 1 (0.2-2.7) 0.7 1 (0.2-3.1) 1.18 1 (0.6-2.4) 1.1 1 (0.5-2.3) 1.54 1 (0.4-6.5) 1.5 1 (0.3-6.9) 2.168 1 (1-4.6) 2.1 1 0.538 0.7 1.1 0.655 1.2 1.1 0.555 1.6 1.1 0.036 1.9 0.9 (1-4.5) * 0.404 1.3 1.0 1.353 (0.7-2.8) 1 1.3 1 (0.6-2.8) Adjusted for birthweight, gestational age, preeclampsi, pregnancy bleedings and other pregnancy complications, maternal age, maternal education and maternal smoking. Missing values for gestational age included as separate category. 131children not included in the analysis due to missing values with regard to other variables than gestational age. 3) a) What is the objective (purpose) of this study? b) What type of design is this? How many subjects are included? c) What is the outcome (“disease”)? What type of frequency (disease occurrence) measure is used? d) What is the main exposure (or exposures)? What type of association measure is used? Could others have been calculated? e) Discuss sources of error. f) Explain the main results in words. a) b) c) d) Hva er hensikten med denne studien? Hvilket design er brukt? Hvor mange personer er inkludert? Hva er utfallsvariabelen (”sykdom”)?. Og hva slags frekvensmål er brukt på denne? Hva er hovedeksponeringen (eller eksponeringene)? Hva slags assosiasjonsmål er brukt? Kunne andre assosiasjonsmål vært regnet ut? e) Diskuter feilkilder. f) Forklar hovedresultatet i ord.
