Additional file 1
advertisement
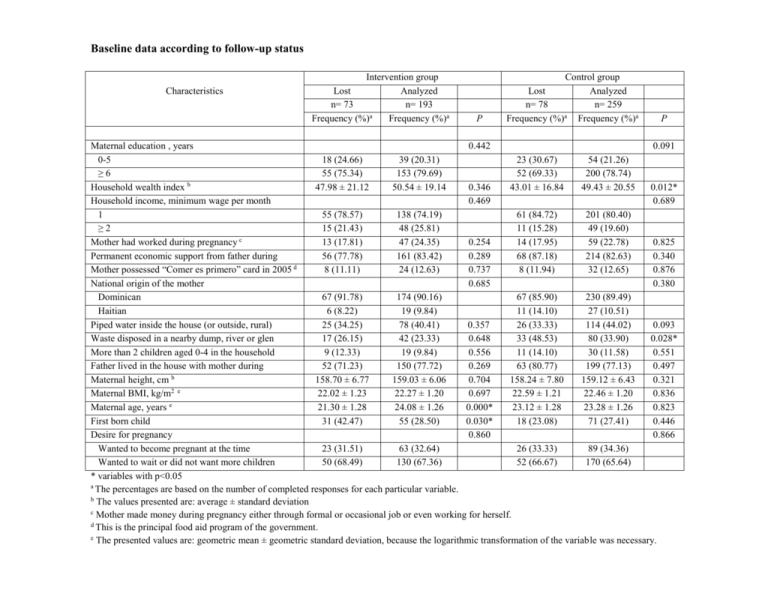
Baseline data according to follow-up status Characteristics Intervention group Lost Analyzed n= 73 n= 193 a Frequency (%) Frequency (%)a P Control group Lost Analyzed n= 78 n= 259 a Frequency (%) Frequency (%)a P Maternal education , years 0.442 0.091 0-5 18 (24.66) 39 (20.31) 23 (30.67) 54 (21.26) ≥6 55 (75.34) 153 (79.69) 52 (69.33) 200 (78.74) Household wealth index b 47.98 ± 21.12 50.54 ± 19.14 0.346 43.01 ± 16.84 49.43 ± 20.55 0.012* Household income, minimum wage per month 0.469 0.689 1 55 (78.57) 138 (74.19) 61 (84.72) 201 (80.40) ≥2 15 (21.43) 48 (25.81) 11 (15.28) 49 (19.60) c Mother had worked during pregnancy 13 (17.81) 47 (24.35) 0.254 14 (17.95) 59 (22.78) 0.825 Permanent economic support from father during 56 (77.78) 161 (83.42) 0.289 68 (87.18) 214 (82.63) 0.340 d pregnanc Mother possessed “Comer es primero” card in 2005 8 (11.11) 24 (12.63) 0.737 8 (11.94) 32 (12.65) 0.876 National origin of the mother 0.685 0.380 Dominican 67 (91.78) 174 (90.16) 67 (85.90) 230 (89.49) Haitian 6 (8.22) 19 (9.84) 11 (14.10) 27 (10.51) Piped water inside the house (or outside, rural) 25 (34.25) 78 (40.41) 0.357 26 (33.33) 114 (44.02) 0.093 Waste disposed in a nearby dump, river or glen 17 (26.15) 42 (23.33) 0.648 33 (48.53) 80 (33.90) 0.028* 9 (12.33) 19 (9.84) 0.556 11 (14.10) 30 (11.58) 0.551 More than 2 children aged 0-4 in the household Father lived in the house with mother during 52 (71.23) 150 (77.72) 0.269 63 (80.77) 199 (77.13) 0.497 pregnancyheight, cm b Maternal 158.70 ± 6.77 159.03 ± 6.06 0.704 158.24 ± 7.80 159.12 ± 6.43 0.321 2 e Maternal BMI, kg/m 22.02 ± 1.23 22.27 ± 1.20 0.697 22.59 ± 1.21 22.46 ± 1.20 0.836 Maternal age, years e 21.30 ± 1.28 24.08 ± 1.26 0.000* 23.12 ± 1.28 23.28 ± 1.26 0.823 First born child 31 (42.47) 55 (28.50) 0.030* 18 (23.08) 71 (27.41) 0.446 Desire for pregnancy 0.860 0.866 Wanted to become pregnant at the time 23 (31.51) 63 (32.64) 26 (33.33) 89 (34.36) Wanted to wait or did not want more children 50 (68.49) 130 (67.36) 52 (66.67) 170 (65.64) * variables with p<0.05 a The percentages are based on the number of completed responses for each particular variable. b The values presented are: average ± standard deviation c Mother made money during pregnancy either through formal or occasional job or even working for herself. d This is the principal food aid program of the government. e The presented values are: geometric mean ± geometric standard deviation, because the logarithmic transformation of the variable was necessary.
