Objective - michelleleba
advertisement
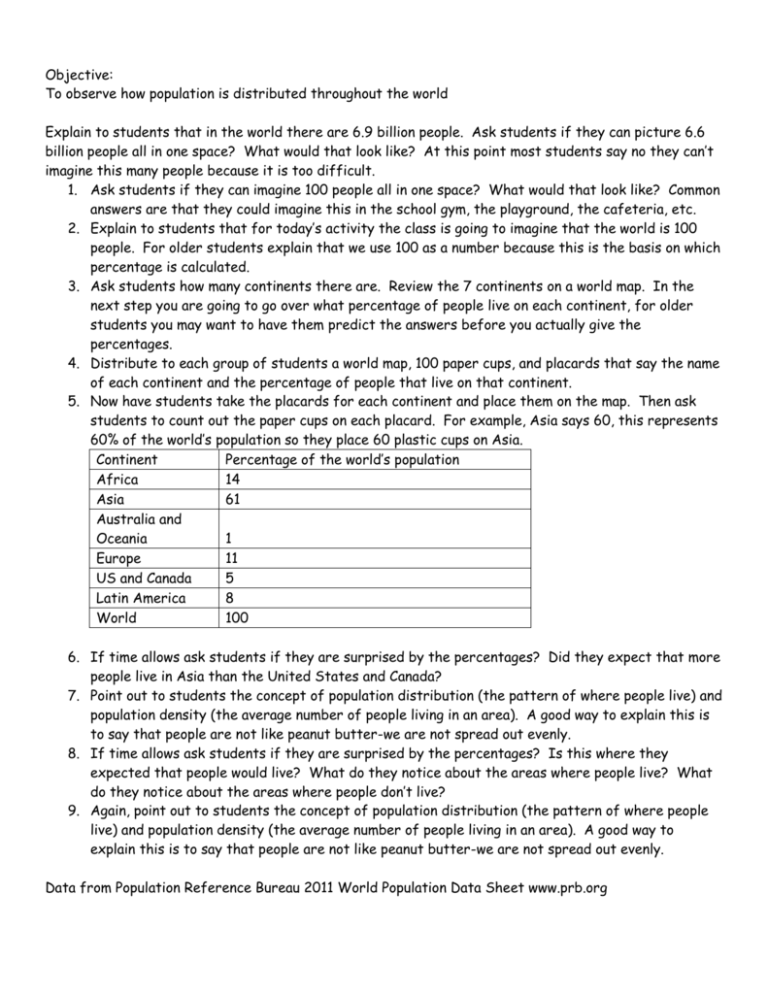
Objective: To observe how population is distributed throughout the world Explain to students that in the world there are 6.9 billion people. Ask students if they can picture 6.6 billion people all in one space? What would that look like? At this point most students say no they can’t imagine this many people because it is too difficult. 1. Ask students if they can imagine 100 people all in one space? What would that look like? Common answers are that they could imagine this in the school gym, the playground, the cafeteria, etc. 2. Explain to students that for today’s activity the class is going to imagine that the world is 100 people. For older students explain that we use 100 as a number because this is the basis on which percentage is calculated. 3. Ask students how many continents there are. Review the 7 continents on a world map. In the next step you are going to go over what percentage of people live on each continent, for older students you may want to have them predict the answers before you actually give the percentages. 4. Distribute to each group of students a world map, 100 paper cups, and placards that say the name of each continent and the percentage of people that live on that continent. 5. Now have students take the placards for each continent and place them on the map. Then ask students to count out the paper cups on each placard. For example, Asia says 60, this represents 60% of the world’s population so they place 60 plastic cups on Asia. Continent Percentage of the world’s population Africa 14 Asia 61 Australia and Oceania 1 Europe 11 US and Canada 5 Latin America 8 World 100 6. If time allows ask students if they are surprised by the percentages? Did they expect that more people live in Asia than the United States and Canada? 7. Point out to students the concept of population distribution (the pattern of where people live) and population density (the average number of people living in an area). A good way to explain this is to say that people are not like peanut butter-we are not spread out evenly. 8. If time allows ask students if they are surprised by the percentages? Is this where they expected that people would live? What do they notice about the areas where people live? What do they notice about the areas where people don’t live? 9. Again, point out to students the concept of population distribution (the pattern of where people live) and population density (the average number of people living in an area). A good way to explain this is to say that people are not like peanut butter-we are not spread out evenly. Data from Population Reference Bureau 2011 World Population Data Sheet www.prb.org
