ap statistics project
advertisement
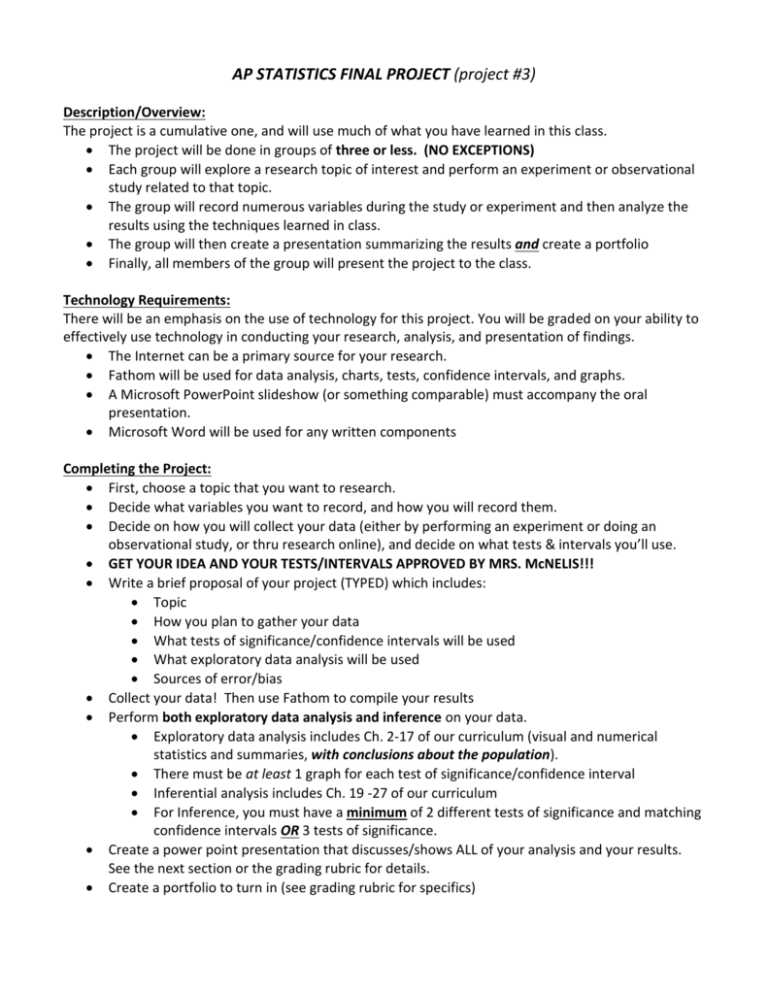
AP STATISTICS FINAL PROJECT (project #3) Description/Overview: The project is a cumulative one, and will use much of what you have learned in this class. The project will be done in groups of three or less. (NO EXCEPTIONS) Each group will explore a research topic of interest and perform an experiment or observational study related to that topic. The group will record numerous variables during the study or experiment and then analyze the results using the techniques learned in class. The group will then create a presentation summarizing the results and create a portfolio Finally, all members of the group will present the project to the class. Technology Requirements: There will be an emphasis on the use of technology for this project. You will be graded on your ability to effectively use technology in conducting your research, analysis, and presentation of findings. The Internet can be a primary source for your research. Fathom will be used for data analysis, charts, tests, confidence intervals, and graphs. A Microsoft PowerPoint slideshow (or something comparable) must accompany the oral presentation. Microsoft Word will be used for any written components Completing the Project: First, choose a topic that you want to research. Decide what variables you want to record, and how you will record them. Decide on how you will collect your data (either by performing an experiment or doing an observational study, or thru research online), and decide on what tests & intervals you’ll use. GET YOUR IDEA AND YOUR TESTS/INTERVALS APPROVED BY MRS. McNELIS!!! Write a brief proposal of your project (TYPED) which includes: Topic How you plan to gather your data What tests of significance/confidence intervals will be used What exploratory data analysis will be used Sources of error/bias Collect your data! Then use Fathom to compile your results Perform both exploratory data analysis and inference on your data. Exploratory data analysis includes Ch. 2-17 of our curriculum (visual and numerical statistics and summaries, with conclusions about the population). There must be at least 1 graph for each test of significance/confidence interval Inferential analysis includes Ch. 19 -27 of our curriculum For Inference, you must have a minimum of 2 different tests of significance and matching confidence intervals OR 3 tests of significance. Create a power point presentation that discusses/shows ALL of your analysis and your results. See the next section or the grading rubric for details. Create a portfolio to turn in (see grading rubric for specifics) * CHECK OUT THE EXAMPLES FROM PREVIOUS YEARS ON THE WIKISPACE and in the SHARE FOLDER * Requirements of the Presentation: At the conclusion of the research, each group will present their research to the class. The presentation must be supported with an interactive PowerPoint slide show (or something comparable). The presentation must last a minimum of 10 minutes, structured as follows: 1. An introduction (including background information on your topic) 2. Summary of Topic and Data collection (what you wanted to analyze and how you collected your data) 3. Discussion and Summary of Data analysis (both exploratory and inferential analysis) 4. Overall conclusions (broadened to the population, with your own opinions, from the data) 5. Application to the population (how do your results and conclusions apply to your population) 6. Bias/Error in your methods and your personal opinions on the research/analysis/results 7. EXTRA CREDIT: An interactive class activity related to your project (Optional) Please see the grading rubric for more details. Each group member should lead part of the presentation. You will also be answering questions from your classmates at the end. Timeline: You will have time in class to complete the project. Use this time wisely. You may need to work outside of class as well. Important dates are as follows: Days in class to work- Jan. 4, 5, 6, 9 Project proposal due – Dec. 16th Research updates due – Dec. 8th, 16th, 22nd (verbal update with Mrs. McNelis) Project Due – Jan. 10th (all projects dropped in drop folder before class starts, NOT at the beginning of class) Presentations – Jan. 10, 11, 12 The project is due on January 10th. NO EXCEPTIONS. The presentation schedule will be determined randomly on that day, so you must be ready even if you don’t get called that day. I will accept volunteers that would like to present first. Grading: The project is worth 200 points- see rubric for exact values NOTES: Surveys of the school: We are not allowed to take an SRS of the student body, and voluntary response samples are not sound methods of data collection. Data collection must be done in another way. If you do any χ2 test, you NEED to include a table with your observed data in your power point. Also, you need to include a table with your expected data. Summary tables from Fathom should NOT be copied & pasted into the power point. Test/Interval boxes from Fathom should NOT be copied & pasted into the power point. 2-way tables (without row/column proportions) and graphs are allowed to be copied & pasted in. Be careful not to put too much information on each slide. Split up graphs, charts, etc. so it is easy to understand your analysis. Be sure to DESCRIBE and ANALYZE all graphs. COMPONENT (1) Proposal (on time and complete, see guidelines) PTS. POSSIBLE 10 (2) Portfolio a. Title page b. Copy of Proposal c. Sources of Research/Procedure of Data Collection d. Data (printed out from Fathom or handwritten) e. Written summary of Findings 2 1 5 5 20 PTS. DEDUCTED _____________ _____________ _____________ _____________ _____________ _____________ (summaries of exploratory and inferential analysis, with intro and conclusion and bias/error) f. Printed slides from presentation (6 per page) 2 _____________ 5 5 5 5 _____________ _____________ _____________ _____________ 15 _____________ 10 5 _____________ _____________ f. Inferential Analysis of Data (2 tests & 2 intervals or 3 tests) i. Conditions (stated and checked thoroughly) ii. Hypotheses iii. Mechanics (for tests and intervals) iv. Conclusions 15 5 20 10 _____________ _____________ _____________ _____________ g. h. i. j. 10 10 10 5 _____________ _____________ _____________ _____________ k. Days Late ( ____ number of days late) - 20 (each day) _____________ l. + 1--10 _____________ 10 10 _____________ _____________ 200 ______________ (3) Presentation a. Length (minimum 10 minutes) b. Description of topic (what you wanted to research) c. Procedure (of data collection and analysis) d. Background on topic e. Exploratory Data Analysis i. Visual and Numerical Statistics (on all your variables) ii. Analysis (of above) iii. Conclusions (about population) Application (of your findings to population) Bias/Error Personal Opinions/Conclusions Q & A (from classmates) Class Activity (extra credit) (4) Individual a. Contributions to groupwork/research b. Contributions to the presentation TOTAL:
