Term Paper – Outline
advertisement
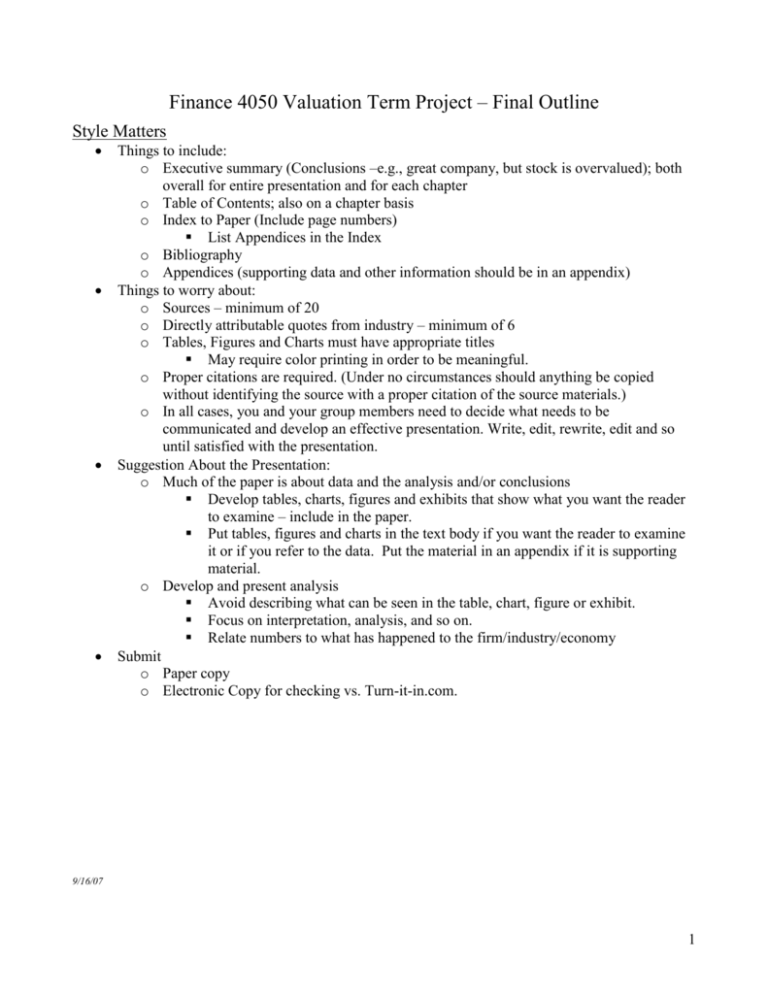
Finance 4050 Valuation Term Project – Final Outline Style Matters Things to include: o Executive summary (Conclusions –e.g., great company, but stock is overvalued); both overall for entire presentation and for each chapter o Table of Contents; also on a chapter basis o Index to Paper (Include page numbers) List Appendices in the Index o Bibliography o Appendices (supporting data and other information should be in an appendix) Things to worry about: o Sources – minimum of 20 o Directly attributable quotes from industry – minimum of 6 o Tables, Figures and Charts must have appropriate titles May require color printing in order to be meaningful. o Proper citations are required. (Under no circumstances should anything be copied without identifying the source with a proper citation of the source materials.) o In all cases, you and your group members need to decide what needs to be communicated and develop an effective presentation. Write, edit, rewrite, edit and so until satisfied with the presentation. Suggestion About the Presentation: o Much of the paper is about data and the analysis and/or conclusions Develop tables, charts, figures and exhibits that show what you want the reader to examine – include in the paper. Put tables, figures and charts in the text body if you want the reader to examine it or if you refer to the data. Put the material in an appendix if it is supporting material. o Develop and present analysis Avoid describing what can be seen in the table, chart, figure or exhibit. Focus on interpretation, analysis, and so on. Relate numbers to what has happened to the firm/industry/economy Submit o Paper copy o Electronic Copy for checking vs. Turn-it-in.com. 9/16/07 1 Notes about the project & its evaluation: 1. Responsibility: a. Each group member is responsible for each chapter of the paper. b. The paper is an integrated whole. 2. Tables/Figures/Charts/Exhibits a. Should be used to effectively present information b. Must have titles and, where applicable, source references. c. Must be in the body of the text if referring to materials. d. If Tables/Figures/Charts/Exhibits relevant to the presentation are stuck in an appendix and the reader is referred to look at Table such and such in the appendix, this is not an acceptable professional approach and your paper is in trouble. e. Materials that are not used to present the story should be in an Appendix to the paper. 3. Appendices a. Each appendix should be number, e.g., Appendix A b. They contain materials that the reader might like to look at, but are not needed to tell the story developed in the paper. c. Should be at the end of the paper. 4. Page Numbering a. Pages must be numbered. b. Pages numbers should follow from one chapter to the next. 5. Within a chapter, use major and minor headings to show topics covered and tell reader that you are moving from one subject to another. 6. A paper or section of the paper with just tables/figures/charts is unacceptable. Must have text to go with the information. 7. Papers should have a. Table of contents (Chapter Titles and Major Sections) with page numbers. b. Proper citation of source materials and direct quotes. i. Direct copy of text should have “” and citation of source materials. c. You may have (optional) an Executive Summary (beginning of paper) d. Bibliography 8. Once done, look over the final presentation to make sure that it is a professional presentation. If it is not, do it over until you get to be what you want. Structure of the Paper: (Subject to Change) The paper is broken into seven “chapters.” o Chapter 1: The Company, Industry and Competitors. o Chapter 2: Financial Performance Analysis o Chapter 3: Cost of Capital, Capital Structure Analysis and Distributions o Chapter 4: Financial Statement Forecasts o Chapter 5: Cash Flow Valuation o Chapter 6: Relative (Multiples) Valuation Analysis o Chapter 7: Summary and Conclusions 2 Chapter 1: The company, industry and competitors. Section 1: Business description (See 10K – Annual Report) Section 2: Brief company history o Focus on recent events – (events that have or will affect value) Acquisitions – divestitures Expansion – contraction announcements New products Law suits Events (possible, probable or for sure that impact cash flows and firm value) Section 3: Products and Competition o Major products Where produced – Where sold Show how each product area contributes to company sales and profits. Identification of major cost components. o Competitors Market share data o Competition (how do firms compete?) Price – quality – service and so on. Who is the “dominant company” in this industry and why is it the dominant company? Section 4: Corporate control (Management and share ownership) o Management qualifications Brief description of the “key” people in the firm. Background How long have they been with the firm? Compensation [salary and options] o Share ownership and compensation plans (compare with comparable companies) Signals / implications?? Executive compensation plans Total compensation = salary + bonus + options Compare with 2 or more similar companies Members of the board of directors (insiders or outsiders) Insider – Institutional Share ownership Compare with “comparable” companies. (Why is this important?) Are insiders buying – holding – selling (recent data) Compare with “comparable” companies Section 5: The future o Financial analysts Analyst earnings and sales estimates Analyst’s buy/sell/hold recommendations. Positive or negative earnings surprises? Use brokerage (analyst) reports o In general, what is going to happen to the company (sales, profits, share price, and so on) over the next five to 10 years? expert opinions (forecasts) your opinion (forecast) 3 Chapter 2: Financial Analysis (historical) Two major sections o Stock price (return) performance over the past 5+ so years o Financial Performance over the past 5+ years Objectives for each section: o Relative to the comparable firms and or index, determine whether your firm is superior, similar or inferior. o Speculate about the reasons for your performance conclusion. o Indicate whether you believe the past performance will or will not continue into the future. Section 1: Stock price performance o Need to compare/contrast company with comparable companies and/or portfolio of comparable companies market o Absolute Performance Arithmetic mean/standard deviation/coefficient of variation Geometric Mean Return (monthly or annualized) $100 grows to _____ Section 2: Financial Performance (three parts) o Part 1: Growth Performance i.e., Yahoo Growth Rates (company, comparables, industry, sector and market) o Part 2: Financial Performance i.e., Yahoo Financial Ratios (company, comparables, industry, sector and market) Financial Condition Ratios/ Profit Margin Ratios/ Management Effectiveness / Efficiency Ratios o Part 3: DuPont Analysis – Company and Industry Calculations, Analysis, Commentary on DuPont components as it affects company’s and industry’s ROA and ROE o Part 3: Altman’s Z-Score Analysis – Company and Industry Calculations, Analysis, Commentary on Z-Score components as it affects company’s and industry’s likelihood of financial distress 4 Chapter 3: Cost of Capital, Capital Structure Analysis and Distributions o Three major sections: Debt, External Equity, Internal Equity Components (i.e., Costs :factors affecting; weights: BV/MV/Target) o Descriptive presentation covering the firm’s capita, its capital structure, and industry’s o Cost of capital Historical numbers Your forecast numbers o Distributions (Dividends and Share repurchases) to shareholders vs. Plowback Historical numbers Forecast of future behavior. Chapter 4: Financial Statement Forecasts o Section 1: Presentation of final forecast parameters/ assumptions. Historical versus your forecast Present/Discuss Basis for/Defend o Section 2: Presentation of your pro forma financial statements Historical and Pro Forma Present/Discuss o Section 3: Presentation of Financial Ratios Historical and Pro Forma Present/Discuss/Defend (what have you done to the company relative to what it was in the past) Chapter 5: Cash Flow Valuation *Present, discuss, defend, analyze, and comment on the cash flow valuations and methods. 5 Chapter 6: Relative (Multiples) Valuation Analysis o Show the list of minimum of 10 comparable companies. State procedures/strategy used to identify companies with comparable financial characteristics o Show and discuss the list of companies and their associated current valuation multiples o Show your multiples valuation of the company o Discuss results. o * Multiples Analysis Format can be used as per class slides from Website instead of below Valuation Ratios Ticker JNJ PG DG SHW Average Std Dev Median S&P 500 Sector Industry Co. I Price Price to Cash Flow Price to Free Cash Flow 5.58 8.06 4.40 5.05 7.54 7.08 5.79 15.91 17.72 14.51 13.53 19.70 7.42 17.89 24.77 29.75 42.15 15.30 40.00 40.29 29.75 3.23 1.29 2.21 4.09 3.31 4.32 16.39 12.78 15.40 26.40 20.23 24.77 3.40 5.67 16.60 25.10 Price to Sales P/E Ratio Beta 19.42 22.14 21.70 17.83 25.69 8.95 23.75 0.18 -0.15 1.06 0.69 0.57 0.42 0.49 3.88 2.81 0.96 1.15 3.38 2.49 2.81 23.16 18.81 19.93 1.00 1.03 0.87 20.64 1.12 $58.90 Price to Book $58.90 $58.90 $58.90 $58.90 Sales Book Cash Flow Free Cash Flow EPS $Value $2.85 $17.32 $10.39 $3.55 Values were obtained using Multiple = Price/$Value Relationship Co.’s Multiples Valuation P/E Ratio Estimated Value Using Median Sample S&P500 Sector Industry $67.77 $66.09 $53.68 $56.87 $2.35 Price to Sales Price to Book Price to Cash Flow Price to Free Cash Flow $48.59 $55.96 $22.35 $38.29 $60.09 $42.49 $34.38 $44.88 $63.46 $58.15 $45.35 $54.64 $69.81 $61.95 $47.47 $58.13 Beta 6 Chapter 7: Summary and Conclusions Value of Operating Assets NonOperating Assets Firm Minority Debt Preferred Interest Stock Equity A Share Cash Flow Valuation Method Entity Valuation APV $33,484 $1,374 $34,859 $31,125 $1,374 $32,500 $978 $978 $0 $0 $0 $33,880 $115.23 $0 $31,521 $107.20 Modified FCFE $33,966 $1,374 $35,341 $978 $0 $0 $34,363 $116.87 $16,907 $1,374 $18,282 $978 2 Based Actual Share Price $17,304 $58.85 2) Based on Closing price ($58.85) Shares outstanding 294.03 (Millions of shares) Once done, look over the final presentation to make sure that it is a professional presentation. If it is not, do it over until you get to be what you want. 7
