Interpreting the Mean Comparisons Report
advertisement
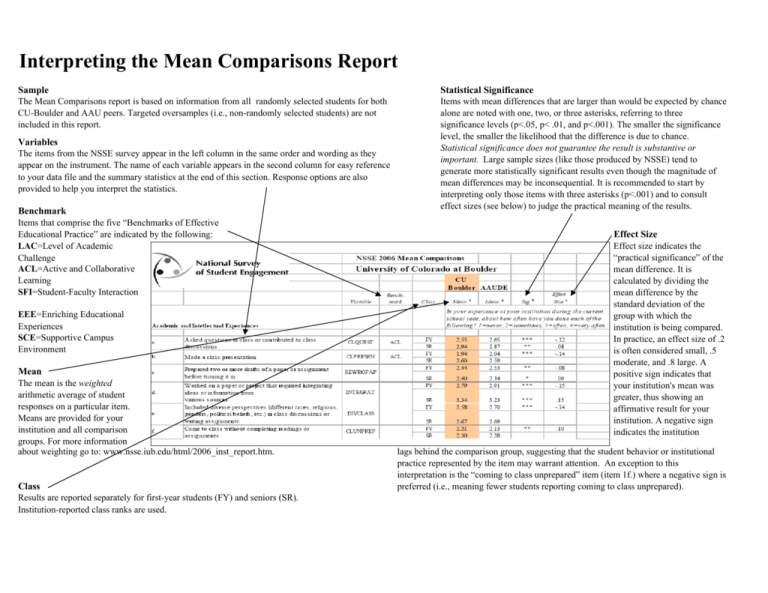
Interpreting the Mean Comparisons Report Sample Statistical Significance The Mean Comparisons report is based on information from all randomly selected students for both CU-Boulder and AAU peers. Targeted oversamples (i.e., non-randomly selected students) are not included in this report. Items with mean differences that are larger than would be expected by chance alone are noted with one, two, or three asterisks, referring to three significance levels (p<.05, p< .01, and p<.001). The smaller the significance level, the smaller the likelihood that the difference is due to chance. Statistical significance does not guarantee the result is substantive or important. Large sample sizes (like those produced by NSSE) tend to generate more statistically significant results even though the magnitude of mean differences may be inconsequential. It is recommended to start by interpreting only those items with three asterisks (p<.001) and to consult effect sizes (see below) to judge the practical meaning of the results. Variables The items from the NSSE survey appear in the left column in the same order and wording as they appear on the instrument. The name of each variable appears in the second column for easy reference to your data file and the summary statistics at the end of this section. Response options are also provided to help you interpret the statistics. Benchmark Items that comprise the five “Benchmarks of Effective Educational Practice” are indicated by the following: LAC=Level of Academic Challenge ACL=Active and Collaborative Learning SFI=Student-Faculty Interaction EEE=Enriching Educational Experiences SCE=Supportive Campus Environment Mean The mean is the weighted arithmetic average of student responses on a particular item. Means are provided for your institution and all comparison groups. For more information about weighting go to: www.nsse.iub.edu/html/2006_inst_report.htm. Class Results are reported separately for first-year students (FY) and seniors (SR). Institution-reported class ranks are used. Effect Size Effect size indicates the “practical significance” of the mean difference. It is calculated by dividing the mean difference by the standard deviation of the group with which the institution is being compared. In practice, an effect size of .2 is often considered small, .5 moderate, and .8 large. A positive sign indicates that your institution's mean was greater, thus showing an affirmative result for your institution. A negative sign indicates the institution lags behind the comparison group, suggesting that the student behavior or institutional practice represented by the item may warrant attention. An exception to this interpretation is the “coming to class unprepared” item (item 1f.) where a negative sign is preferred (i.e., meaning fewer students reporting coming to class unprepared).
