MATH141_Apr2014 - Heartland Community College
advertisement
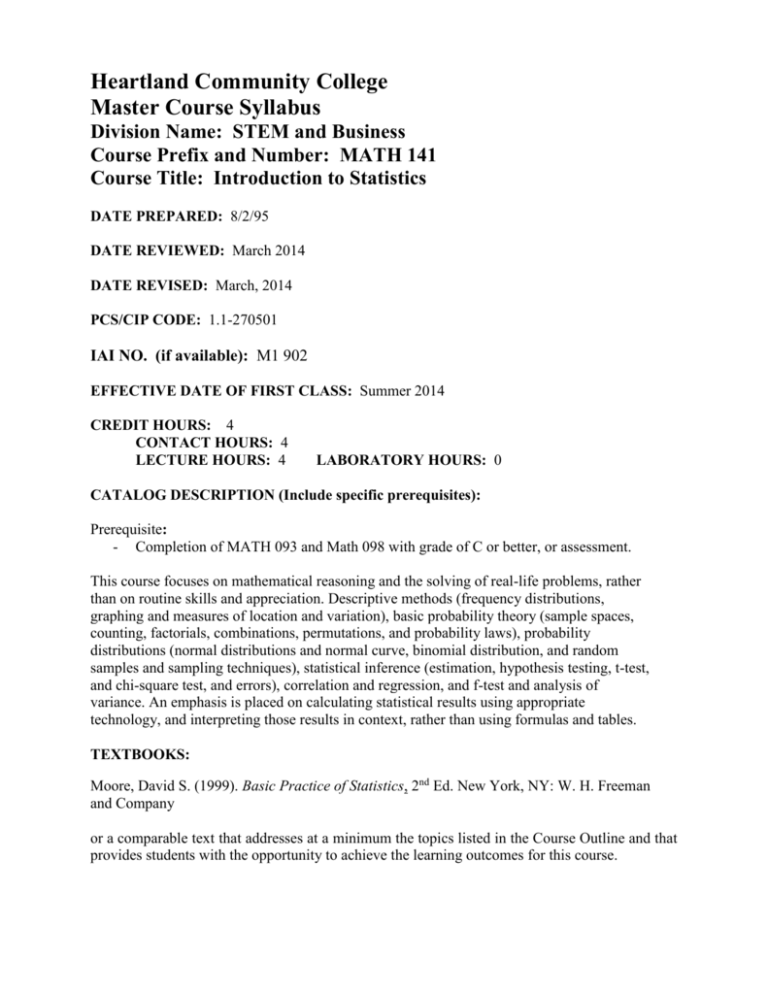
Heartland Community College Master Course Syllabus Division Name: STEM and Business Course Prefix and Number: MATH 141 Course Title: Introduction to Statistics DATE PREPARED: 8/2/95 DATE REVIEWED: March 2014 DATE REVISED: March, 2014 PCS/CIP CODE: 1.1-270501 IAI NO. (if available): M1 902 EFFECTIVE DATE OF FIRST CLASS: Summer 2014 CREDIT HOURS: 4 CONTACT HOURS: 4 LECTURE HOURS: 4 LABORATORY HOURS: 0 CATALOG DESCRIPTION (Include specific prerequisites): Prerequisite: - Completion of MATH 093 and Math 098 with grade of C or better, or assessment. This course focuses on mathematical reasoning and the solving of real-life problems, rather than on routine skills and appreciation. Descriptive methods (frequency distributions, graphing and measures of location and variation), basic probability theory (sample spaces, counting, factorials, combinations, permutations, and probability laws), probability distributions (normal distributions and normal curve, binomial distribution, and random samples and sampling techniques), statistical inference (estimation, hypothesis testing, t-test, and chi-square test, and errors), correlation and regression, and f-test and analysis of variance. An emphasis is placed on calculating statistical results using appropriate technology, and interpreting those results in context, rather than using formulas and tables. TEXTBOOKS: Moore, David S. (1999). Basic Practice of Statistics, 2nd Ed. New York, NY: W. H. Freeman and Company or a comparable text that addresses at a minimum the topics listed in the Course Outline and that provides students with the opportunity to achieve the learning outcomes for this course. RELATIONSHIP TO ACADEMIC DEVELOPMENT PROGRAMS AND TRANSFERABILITY: MATH 141 fulfills 4 of the semester hours of credit in Mathematics required for the A.A. or A.S. degree. This course should transfer as part of the General Education Core Curriculum described in the Illinois Articulation Initiative to other Illinois colleges and universities participating in the IAI. However, students should consult an academic advisor for transfer information regarding particular institutions. Refer to the IAI web page for information as well at www.itransfer.org. LEARNING OUTCOMES: Course Outcomes Organize and present data using statistical charts and graphs. Obtain or generate data. Generate a random sample. Graph data and determine if the graph is enough to answer the question of interest. Analyze and summarize data sets. Find measures of center using technology. Construct and analyze frequency distributions for a set of data. Demonstrate why association is not causation Apply probability theory to determine probabilities based on sample data. Assess whether a data set is compliant with the assumptions associated with statistical procedures. Know and apply sampling techniques used to generate sampling distributions. Determine probabilities associated with sampling distributions. Properly analyze a statistical question using hypothesis testing, significance levels and p-values using technology for calculations. Demonstrate why statistical significance does not necessarily imply practical importance. Use technology to properly analyze a statistical question using confidence intervals, including the interpretation of confidence intervals. Communicate the results of a statistical analysis. Analyze the relationship between two variables to determine if there is a significant correlation between them and if so, determine the linear relation between the two variables. Test a claim regarding three or more means using one-way ANOVA. Essential Competencies Range of Assessment Methods Throughout the semester, the following assessment methods will be used to measure the course and Essential Competencies: Homework; Quizzes; Discussion Postings; Exams; Projects CT 2 PS 2 CO 2 PS2: Student identifies the type of problem and use a framework to solve the problem. CT2: Students determine value of multiple sources or strategies and select those most appropriate in a given context. CO2: Students effectively deliver a message via various channels/modalities. COURSE/LAB OUTLINE: 1. 2. 3. 4. 5. 6. 7. 8. Graphical Descriptions of Data Measures of Central Tendency and Variability Introduction to Probability and Probability Distributions Sampling Techniques and Distributions Confidence Intervals Hypothesis Testing Correlation and Regression ANOVA METHOD OF EVALUATION (Tests/Exams, Grading System): Instructors may determine the most appropriate methods of evaluation for their course. These methods of evaluation might include but are not limited to unit test(s), quiz(zes), homework, project(s), and a comprehensive final exam. GRADING SCALE: 90 S.P. 100 A 80 S.P. 90 B 70 S.P. 80 C 60 S.P. 70 D 00 S.P. 60 F S.P. = student performance REQUIRED WRITING AND READING: Required writing will be part of most assignments and tests. Students will be expected to explain how they found the solution, describe the solution graphically, and interpret the answer in the context of the problem. Students are expected to read the material in the textbook for each section studied, typically 10-15 pages per section.

