Aust. July Labour Force: 14k, u/e 5.2% OK at face value, BUT

9 August 2012
Aust. July Labour Force: 14k, u/e 5.2%
OK at face value, BUT...
•
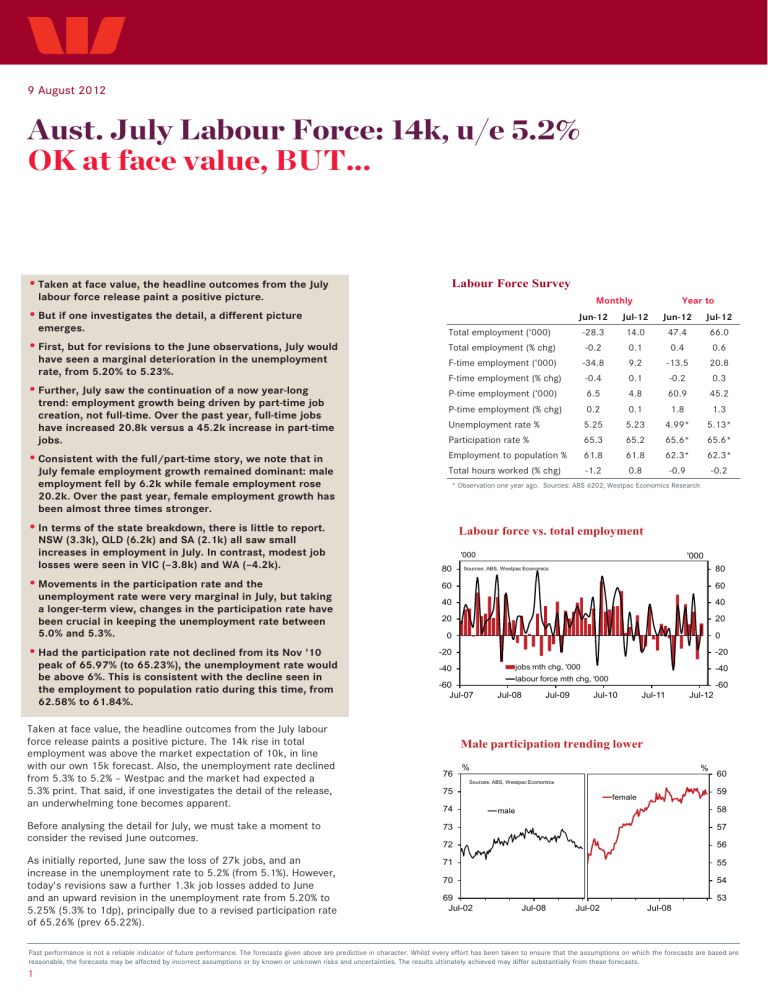
Taken at face value, the headline outcomes from the July labour force release paint a positive picture.
•
But if one investigates the detail, a different picture emerges.
•
First, but for revisions to the June observations, July would have seen a marginal deterioration in the unemployment rate, from 5.20% to 5.23%.
•
Further, July saw the continuation of a now year-long trend: employment growth being driven by part-time job creation, not full-time. Over the past year, full-time jobs have increased 20.8k versus a 45.2k increase in part-time jobs.
•
Consistent with the full/part-time story, we note that in
July female employment growth remained dominant: male employment fell by 6.2k while female employment rose
20.2k. Over the past year, female employment growth has been almost three times stronger.
•
In terms of the state breakdown, there is little to report.
NSW (3.3k), QLD (6.2k) and SA (2.1k) all saw small increases in employment in July. In contrast, modest job losses were seen in VIC (–3.8k) and WA (–4.2k).
•
Movements in the participation rate and the unemployment rate were very marginal in July, but taking a longer-term view, changes in the participation rate have been crucial in keeping the unemployment rate between
5.0% and 5.3%.
•
Had the participation rate not declined from its Nov '10 peak of 65.97% (to 65.23%), the unemployment rate would be above 6%. This is consistent with the decline seen in the employment to population ratio during this time, from
62.58% to 61.84%.
Taken at face value, the headline outcomes from the July labour force release paints a positive picture. The 14k rise in total employment was above the market expectation of 10k, in line with our own 15k forecast. Also, the unemployment rate declined from 5.3% to 5.2% – Westpac and the market had expected a
5.3% print. That said, if one investigates the detail of the release, an underwhelming tone becomes apparent.
Before analysing the detail for July, we must take a moment to consider the revised June outcomes.
As initially reported, June saw the loss of 27k jobs, and an increase in the unemployment rate to 5.2% (from 5.1%). However, today's revisions saw a further 1.3k job losses added to June and an upward revision in the unemployment rate from 5.20% to
5.25% (5.3% to 1dp), principally due to a revised participation rate of 65.26% (prev 65.22%).
Labour Force Survey
Total employment (‘000)
Total employment (% chg)
F-time employment (‘000)
F-time employment (% chg)
P-time employment (‘000)
Monthly Year to
Jun-12 Jul-12 Jun-12 Jul-12
-28.3
-0.2
-34.8
-0.4
6.5
14.0
0.1
9.2
0.1
4.8
47.4
0.4
-13.5
-0.2
60.9
P-time employment (% chg)
Unemployment rate %
Participation rate %
Employment to population %
Total hours worked (% chg)
0.2
5.25
65.3
61.8
-1.2
0.1
5.23
65.2
61.8
0.8
1.8
1.3
4.99* 5.13*
65.6* 65.6*
62.3* 62.3*
-0.9
* Observation one year ago. Sources: ABS 6202, Westpac Economics Research
-0.2
66.0
0.6
20.8
0.3
45.2
Labour force vs. total employment
80
'000
Sources: ABS, Westpac Economics
60
40
20
0
-20
-40
-60
Jul-07 jobs mth chg, '000 labour force mth chg, '000
Jul-08 Jul-09 Jul-10 Jul-11
'000
-20
-40
Jul-12
-60
80
60
40
20
0
Male participation trending lower
76
%
Sources: ABS, Westpac Economics
75
74
73 male
72
71
70
69
Jul-02 Jul-08 Jul-02 female
Jul-08
%
60
59
58
57
56
55
54
53
Past performance is not a reliable indicator of future performance. The forecasts given above are predictive in character. Whilst every effort has been taken to ensure that the assumptions on which the forecasts are based are reasonable, the forecasts may be affected by incorrect assumptions or by known or unknown risks and uncertainties. The results ultimately achieved may differ substantially from these forecasts.
1
9 August 2012
Had these revisions not occurred, the unemployment rate would have deteriorated at the margin in July, from 5.20% to 5.23%.
Clearly it is not appropriate to regard the July report as evidence in favour of a turning point. In isolation, July is a 'neutral' jobs report, but when viewed together with recent history, it is further evidence of a somewhat concerning trend: sub-par job creation, particularly for full-time and male workers.
In July, full-time employment rose by 9.2k, only partially offsetting
June's 34.8k fall; part-time employment saw another modest rise of 4.8k. Over the past year, full-time positions have risen by only
20.8k, less than half the 45.2k rise in part-time work. This is a stark contrast to the year to July 2011, when 173k full-time jobs were added, compared to 16k part-time jobs. Needless to say, the shift from full-time to part-time employment growth is not a positive for household incomes.
The other important split within the detail is male and female employment growth. In July, male employment fell by 6.2k while female employment rose 20.2k; that follows the loss of 10.2k male jobs and 18.1k female jobs in June. More broadly, over the past year, female employment growth has been almost three times that of males (48.4k versus 17.6k). Historically, male incomes have been higher than female incomes, so this trend also points to soft household income growth.
In terms of the state breakdown, there is little to report. NSW
(3.3k), QLD (6.2k) and SA (2.1k) all saw a small increase in employment in July; in contrast, modest job losses were seen in
VIC (–3.8k) and WA (–4.2k). NSW (5.2%), VIC (5.4%) and WA's
(3.6%) unemployment rates were broadly stable in the month;
QLD's rose (from 5.3% to 5.8%) and SA's fell (from 6.4% to 5.4%), primarily due to movements in the participation rate.
As noted above, movements in the participation rate and the unemployment rate were very marginal in July: the unemployment rate edged 0.02ppts lower to 5.23%, while the participation rate edged 0.01ppts lower to 65.25%.
However, taking a longer-term view, changes in the participation rate have been crucial in keeping the unemployment rate near
5%. Specifically, had the participation rate not declined over the past year (from 65.62% to 65.25%), the unemployment rate would have risen to almost 5.8% – our 2012 year-end target. If the participation rate had remained unchanged from its November
2010 peak of 65.97%, then the unemployment rate would have already risen above 6%.
Given the significant impact that the falling participation rate is having on the unemployment rate, it makes sense to cross-check our analysis against an indicator which is not affected by this noise – the employment to population ratio. Since the Nov '10 peak in the participation rate, the employment to population ratio has declined from 62.58% to 61.84%. That is a near two-year low and a level that the ratio has (broadly speaking) remained above for the past six years. This is not a trend that is logically consistent with a broadly-stable unemployment rate.
Overall, the July labour force survey is consistent with our long-held expectation that employment growth will maintain a decidedly modest pace through the second half of 2012.
Continued working-age population growth, a broadly stable participation rate, and modest job increases would see the unemployment rate rise to around 5.8% by year's end. The soft tone of recent business survey data and the trend rise in the
Westpac–MI consumer unemployment expectations index is consistent with this view.
Elliot Clarke, Economist +61 (2) 8253 8476
Full-time employment growth weak
3
0
-3
12
%ann
Sources: ABS, Westpac Economics
9
6
-6
-9
Jul-96 part-time (lhs)
Jul-00 Jul-04 full-time (rhs)
Jul-08
7.0
%
6.0
NSW
Vic
5.0
4.0
NSW & Vic starting to converge
3.0
Sources: ABS, Westpac Economics
2.0
Jul-07 Jul-10 Jul-07
Unemployment supported by participation
8
%
Sources: ABS, Westpac Economics
7 if part-rate held 65.62% from Jul 11 unemployment rate
6
%
8
7
6
5
4
3
Jul-00 Jul-03 Jul-06
Unemployment moving sideways in Qld
WA
Qld
Trending down again in WA
Jul-10
Jul-09
%ann
4
2
0
-2
Jul-12
-4
Unemployment by state; WA trending down
% monthly
7.0
6.0
Jul-12
3
Unemployment vs. employment/pop ratio
0.64
0.63
0.62
ratio
Sources: ABS, Westpac Economics employment/pop ratio (lhs) unemployment rate (rhs)
0.61
0.60
0.59
0.58
0.57
Jul-96 Jul-01 Jul-06 Jul-11
%
5.0
4.0
3.0
2.0
5
4
9
7
5
3
Past performance is not a reliable indicator of future performance. The forecasts given above are predictive in character. Whilst every effort has been taken to ensure that the assumptions on which the forecasts are based are reasonable, the forecasts may be affected by incorrect assumptions or by known or unknown risks and uncertainties. The results ultimately achieved may differ substantially from these forecasts.
2
Disclaimer
Westpac Institutional Bank is a division of Westpac Banking Corporation ABN 33 007 457 141 AFSL 233714 (‘Westpac’). This document is provided to you solely for your own use and in your capacity as a wholesale client of Westpac. The information contained in this communication does not constitute an offer, or a solicitation of an offer, to subscribe for or purchase any securities or other financial instrument; does not constitute an offer, inducement or solicitation to enter a legally binding contract. The information is general and preliminary market information only and while Westpac has made every effort to ensure that information is free from error, Westpac does not warrant the accuracy, adequacy or completeness of the Information. The information may contain material provided directly by third parties and while such material is published with necessary permission, Westpac accepts no responsibility for the accuracy or completeness of any such material. Although we have made every effort to ensure the information is from error, Westpac does not warrant the accuracy, adequacy or completeness of the information, or otherwise endorse it in any way. Except where contrary to law, Westpac intends by this notice to exclude liability for the information. The information is subject to change without notice and Westpac is under no obligation to update the information or correct any inaccuracy which may become apparent at a later date. Past performance is not a reliable indicator of future performance. The forecasts given in this document are predictive in character. Whilst every effort has been taken to ensure that the assumptions on which the forecasts are based are reasonable, the forecasts may be affected by incorrect assumptions or by known or unknown risks and uncertainties. The ultimate outcomes may differ substantially from these forecasts.
This communication does not constitute a personal recommendation to any individual investor. In preparing the information, Westpac has not taken into consideration the financial situation, investment objectives or particular needs of any particular investor and recommends that investors seek independent advice before acting on the information. Certain types of transactions, including those involving futures, options and high yield securities give rise to substantial risk and are not suitable for all investors. Except where contrary to law, Westpac intends by this notice to exclude liability for the information. The information is subject to change without notice. A product disclosure statement (“PDS”) may be available for the products referred to in this document. A copy of the relevant PDS and a copy of Westpac’s Financial Services Guide can be obtained by visiting www.westpac.com.au/disclosure-documents. You should obtain and consider the relevant PDS before deciding whether to acquire, continue to hold or dispose of the applicable products referred to in this document.
This document is being distributed by Westpac Banking Corporation London Branch and Westpac Europe Limited only to and is directed at a) persons who have professional experience in matters relating to investments falling within Article 19(1) of the Financial Services Act 2000 (Financial Promotion) Order 2005 or (b) high net worth entities, and other persons to whom it may otherwise be lawfully be communicated, falling within Article 49(1) of the Order (all such persons together being referred to as “relevant persons”). The investments to which this document relates are only available to and any invitation, offer or agreement to subscribe, purchase or otherwise acquire such investments will be engaged in only with, relevant persons. Any person who is not a relevant person should not act or rely upon this document or any of its contents. In the same way, the information contained in this document is intended for “eligible counterparties” and “professional clients” as defined by the rules of the Financial Services
Authority and is not intended for “retail clients”. With this in mind, Westpac expressly prohibits you from passing on this document to any third party. In particular this presentation and any copy of it may not be taken, transmitted or distributed, directly or indirectly into the United States and any other restricted jurisdiction.
This document has been approved solely for the purposes of section 21 of the Financial Services and Markets Act 2000 by Westpac Banking Corporation London Branch and
Westpac Europe Limited. Westpac Banking Corporation is registered in England as a branch (branch number BR000106) and is authorised and regulated by The Financial
Services Authority. Westpac Europe Limited is a company registered in England (number 05660023) and is authorised and regulated by The Financial Services Authority.
Westpac operates in the United States of America as a federally chartered branch, regulated by the Office of the Controller of the Currency and is not affiliated with either:
(i) a broker dealer registered with the US Securities Exchange Commission; or (ii) a Futures Commission Merchant registered with the US Commodity Futures Trading
Commission. If you wish to be removed from our e-mail, fax or mailing list please send an e-mail to economics@westpac.com.au or fax us on +61 2 8254 6907 or write to Westpac Economics at Level 2, 275 Kent Street, Sydney NSW 2000. Please state your full name, telephone/fax number and company details on all correspondence. ©
2012 Westpac Banking Corporation.
3


