CHEM-1BL
advertisement

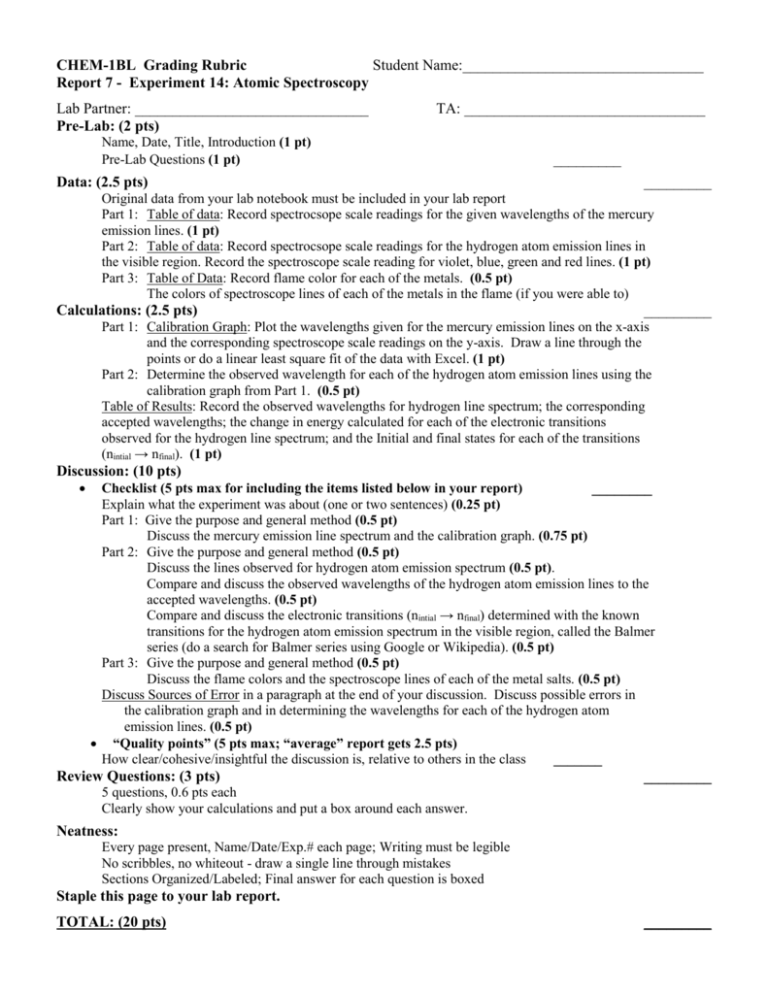
CHEM-1BL Grading Rubric Student Name:________________________________ Report 7 - Experiment 14: Atomic Spectroscopy Lab Partner: _______________________________ Pre-Lab: (2 pts) TA: ________________________________ Name, Date, Title, Introduction (1 pt) Pre-Lab Questions (1 pt) Data: (2.5 pts) _________ _________ Original data from your lab notebook must be included in your lab report Part 1: Table of data: Record spectrocsope scale readings for the given wavelengths of the mercury emission lines. (1 pt) Part 2: Table of data: Record spectrocsope scale readings for the hydrogen atom emission lines in the visible region. Record the spectroscope scale reading for violet, blue, green and red lines. (1 pt) Part 3: Table of Data: Record flame color for each of the metals. (0.5 pt) The colors of spectroscope lines of each of the metals in the flame (if you were able to) Calculations: (2.5 pts) _________ Part 1: Calibration Graph: Plot the wavelengths given for the mercury emission lines on the x-axis and the corresponding spectroscope scale readings on the y-axis. Draw a line through the points or do a linear least square fit of the data with Excel. (1 pt) Part 2: Determine the observed wavelength for each of the hydrogen atom emission lines using the calibration graph from Part 1. (0.5 pt) Table of Results: Record the observed wavelengths for hydrogen line spectrum; the corresponding accepted wavelengths; the change in energy calculated for each of the electronic transitions observed for the hydrogen line spectrum; and the Initial and final states for each of the transitions (nintial → nfinal). (1 pt) Discussion: (10 pts) Checklist (5 pts max for including the items listed below in your report) ________ Explain what the experiment was about (one or two sentences) (0.25 pt) Part 1: Give the purpose and general method (0.5 pt) Discuss the mercury emission line spectrum and the calibration graph. (0.75 pt) Part 2: Give the purpose and general method (0.5 pt) Discuss the lines observed for hydrogen atom emission spectrum (0.5 pt). Compare and discuss the observed wavelengths of the hydrogen atom emission lines to the accepted wavelengths. (0.5 pt) Compare and discuss the electronic transitions (nintial → nfinal) determined with the known transitions for the hydrogen atom emission spectrum in the visible region, called the Balmer series (do a search for Balmer series using Google or Wikipedia). (0.5 pt) Part 3: Give the purpose and general method (0.5 pt) Discuss the flame colors and the spectroscope lines of each of the metal salts. (0.5 pt) Discuss Sources of Error in a paragraph at the end of your discussion. Discuss possible errors in the calibration graph and in determining the wavelengths for each of the hydrogen atom emission lines. (0.5 pt) “Quality points” (5 pts max; “average” report gets 2.5 pts) How clear/cohesive/insightful the discussion is, relative to others in the class _______ Review Questions: (3 pts) _________ 5 questions, 0.6 pts each Clearly show your calculations and put a box around each answer. Neatness: Every page present, Name/Date/Exp.# each page; Writing must be legible No scribbles, no whiteout - draw a single line through mistakes Sections Organized/Labeled; Final answer for each question is boxed Staple this page to your lab report. TOTAL: (20 pts) _________


