stem and leaf plot guide pract
advertisement
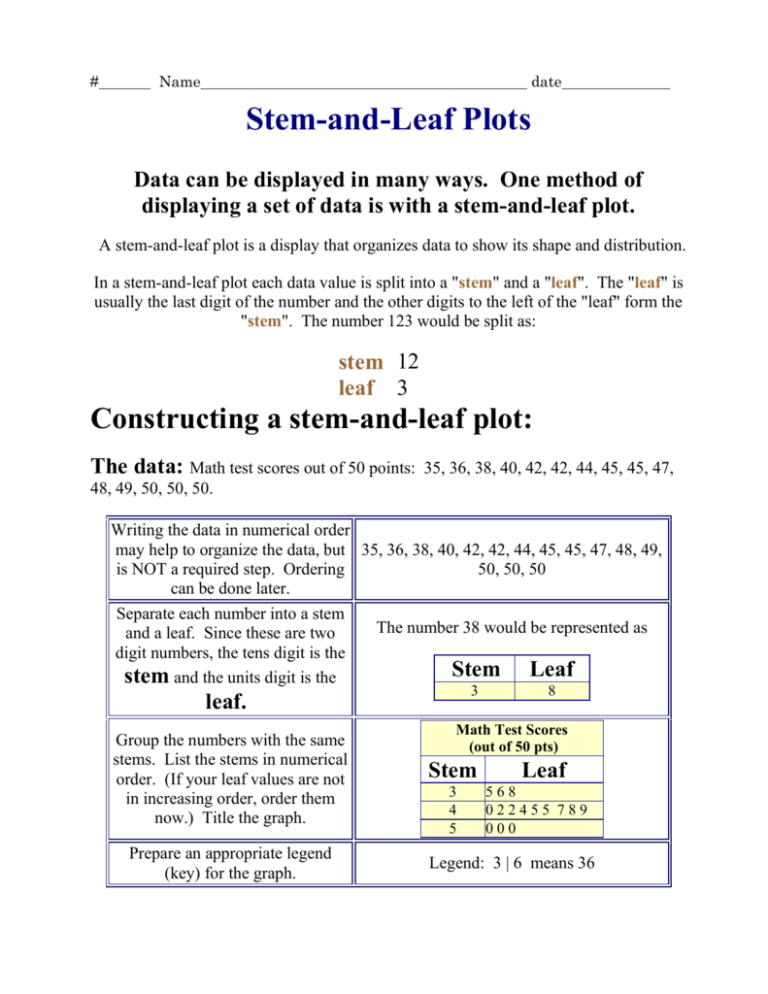
# Name date Stem-and-Leaf Plots Data can be displayed in many ways. One method of displaying a set of data is with a stem-and-leaf plot. A stem-and-leaf plot is a display that organizes data to show its shape and distribution. In a stem-and-leaf plot each data value is split into a "stem" and a "leaf". The "leaf" is usually the last digit of the number and the other digits to the left of the "leaf" form the "stem". The number 123 would be split as: stem 12 leaf 3 Constructing a stem-and-leaf plot: The data: Math test scores out of 50 points: 35, 36, 38, 40, 42, 42, 44, 45, 45, 47, 48, 49, 50, 50, 50. Writing the data in numerical order may help to organize the data, but 35, 36, 38, 40, 42, 42, 44, 45, 45, 47, 48, 49, is NOT a required step. Ordering 50, 50, 50 can be done later. Separate each number into a stem The number 38 would be represented as and a leaf. Since these are two digit numbers, the tens digit is the Stem Leaf stem and the units digit is the 3 leaf. Group the numbers with the same stems. List the stems in numerical order. (If your leaf values are not in increasing order, order them now.) Title the graph. Prepare an appropriate legend (key) for the graph. 8 Math Test Scores (out of 50 pts) Stem 3 4 5 Leaf 568 022455 789 000 Legend: 3 | 6 means 36 A stem-and-leaf plot shows the shape and distribution of data. It can be clearly seen in the diagram above that the data clusters around the row with a stem of 4. Notes: The leaf is the digit in the place farthest to the right in the number, and the stem is the digit, or digits, in the number that remain when the leaf is dropped. To show a one-digit number (such as 9) using a stem-and-leaf plot, use a stem of 0 and a leaf of 9. To find the median in a stem-and-leaf plot, count off half the total number of leaves. A stem and leaf plot, or stem plot, is a technique used to classify either discrete or continuous variables. A stem and leaf plot is used to organize data as they are collected. A stem and leaf plot looks something like a bar graph. Each number in the data is broken down into a stem and a leaf, thus the name. The stem of the number includes all but the last digit. The leaf of the number will always be a single digit. Elements of a good stem and leaf plot A good stem and leaf plot shows the first digits of the number (thousands, hundreds or tens) as the stem and shows the last digit (ones) as the leaf. usually uses whole numbers. Anything that has a decimal point is rounded to the nearest whole number. For example, test results, speeds, heights, weights, etc. looks like a bar graph when it is turned on its side. shows how the data are spread—that is, highest number, lowest number, most common number and outliers (a number that lies outside the main group of numbers). Tips on how to draw a stem and leaf plot Once you have decided that a stem and leaf plot is the best way to show your data, draw it as follows: On the left hand side of the page, write down the thousands, hundreds or tens (all digits but the last one). These will be your stems. Draw a line to the right of these stems. On the other side of the line, write down the ones (the last digit of a number). These will be your leaves. For example, if the observed value is 25, then the stem is 2 and the leaf is the 5. If the observed value is 369, then the stem is 36 and the leaf is 9. Where observations are accurate to one or more decimal places, such as 23.7, the stem is 23 and the leaf is 7. If the range of values is too great, the number 23.7 can be rounded up to 24 to limit the number of stems. In stem and leaf plots, tally marks are not required because the actual data are used. Not quite getting it? Try some exercises. Example 1 –Making a stem and leaf plot A teacher asked 10 of her students how many books they had read in the last 12 months. Their answers were as follows: 12, 23, 19, 6, 10, 7, 15, 25, 21, 12 Prepare a stem and leaf plot for these data. Tip: The number 6 can be written as 06, which means that it has a stem of 0 and a leaf of 6. The stem and leaf plot should look like this: Table 2. Books read in a year by 10 students Stem Leaf 0 67 1 29052 2 351 In Table 2: stem 0 represents the class interval 0 to 9; stem l represents the class interval 10 to 19; and stem 2 represents the class interval 20 to 29. Usually, a stem and leaf plot is ordered, which simply means that the leaves are arranged in ascending order from left to right. Also, there is no need to separate the leaves (digits) with punctuation marks (commas or periods) since each leaf is always a single digit. Using the data from Table 2, we made the ordered stem and leaf plot shown below: Table 3. Books read in a year by 10 students Stem Leaf 0 67 1 02259 2 135 Example 4 – Splitting stems using decimal values The weights (to the nearest tenth of a kilogram) of 30 students were measured and recorded as follows: 59.2, 61.5, 62.3, 61.4, 60.9, 59.8, 60.5, 59.0, 61.1, 60.7, 61.6, 56.3, 61.9, 65.7, 60.4, 58.9, 59.0, 61.2, 62.1, 61.4, 58.4, 60.8, 60.2, 62.7, 60.0, 59.3, 61.9, 61.7, 58.4, 62.2 Prepare an ordered stem and leaf plot for the data. Briefly comment on what the analysis shows. Answer In this case, the stems will be the whole number values and the leaves will be the decimal values. The data range from 56.3 to 65.7, so the stems should start at 56 and finish at 65. Table 8. Weights of 30 students Stem Leaf 56 3 57 58 449 59 00238 60 0245789 61 124456799 62 1237 63 64 65 7 In this example, it was not necessary to split stems because the leaves are not crowded on too few stems; nor was it necessary to round the values, since the range of values is not large. This stem and leaf plot reveals that the group with the highest number of observations recorded is the 61.0 to 61.9 group. A teacher asked 10 of her students how many books they had read in the last 12 months. Their answers were as follows: 12, 23, 19, 6, 10, 7, 15, 25, 21, 12 Prepare a stem and leaf plot for these data. Tip: The number 6 can be written as 06, which means that it has a stem of 0 and a leaf of 6. Fifteen people were asked how often they drove to work over 10 working days. The number of times each person drove was as follows: 5, 7, 9, 9, 3, 5, 1, 0, 0, 4, 3, 7, 2, 9, 8 Make an ordered stem and leaf plot for this table. The weights (to the nearest tenth of a kilogram) of 30 students were measured and recorded as follows: 59.2, 61.5, 62.3, 61.4, 60.9, 59.8, 60.5, 59.0, 61.1, 60.7, 61.6, 56.3, 61.9, 65.7, 60.4, 58.9, 59.0, 61.2, 62.1, 61.4, 58.4, 60.8, 60.2, 62.7, 60.0, 59.3, 61.9, 61.7, 58.4, 62.2 Prepare an ordered stem and leaf plot for the data. Briefly comment on what the analysis shows. The results of 41 students' math tests (with a best possible score of 70) are recorded below: 31, 49, 19, 62, 50, 24, 45, 23, 51, 32, 48, 55, 60, 40, 35, 54, 26, 57, 37, 43, 65, 50, 55, 18, 53, 41, 50, 34, 67, 56, 44, 4, 54, 57, 39, 52, 45, 35, 51, 63, 42 Prepare an ordered stem and leaf plot for the data and briefly describe what it shows. Are there any outliers? If so, which scores?


