doc - Department of Atmospheric Sciences
ATMO551a Fall 2010
Vertical Structure of Earth’s Atmosphere
Thin as a piece of paper…
The atmosphere is a very thin layer above the solid Earth and its oceans. This is true of the atmospheres of all of the terrestrial planets. In contrast, the gas giants like Jupiter may be essentially entirely gaseous becoming liquid at very high pressures in the interior with perhaps a small solid planet very deep inside.
Earth’s atmosphere is very thin. The altitude at which transcontinental planes fly is about
30,000 ft or 10 km. The pressure at this altitude is about 250 mb which is roughly 25% of the surface pressure. So 75% of the atmosphere lies between the surface and 10 km. The radius of the Earth is about 6400 km. So the thickness of 75% of the atmosphere is about 0.15% of the thickness of the Earth. The analogy has been made that if the Earth were the size of a basketball, the thickness of the atmosphere would be less than the thickness of a sheet of paper. This is the world in which we live.
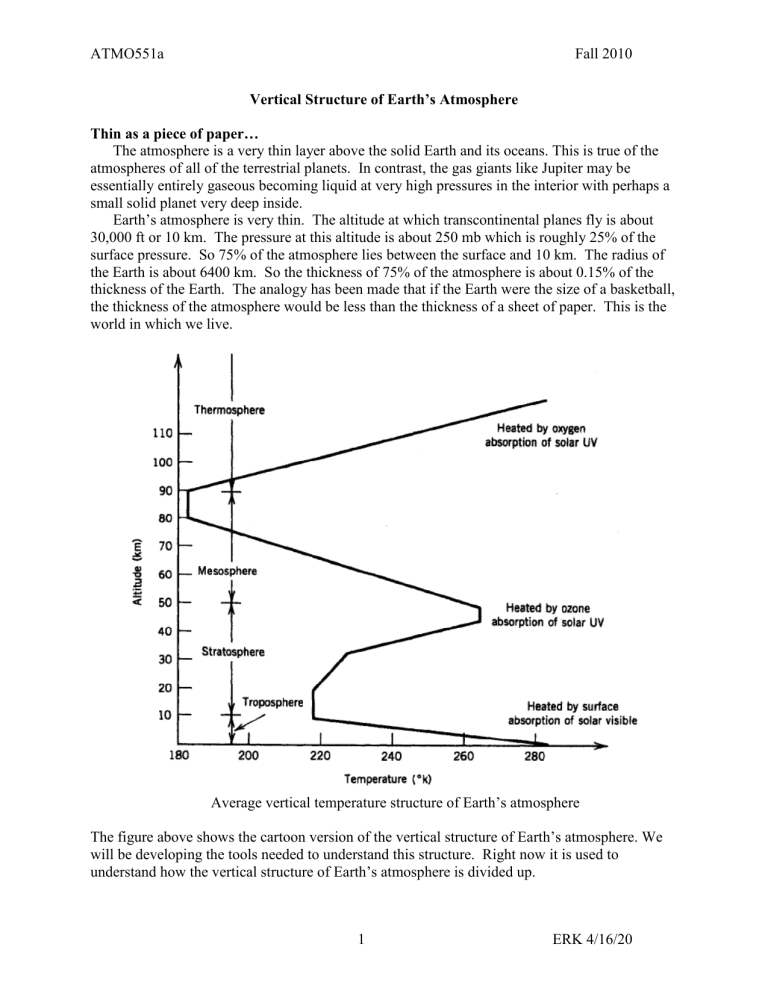
Average vertical temperature structure of Earth’s atmosphere
The figure above shows the cartoon version of the vertical structure of Earth’s atmosphere. We will be developing the tools needed to understand this structure. Right now it is used to understand how the vertical structure of Earth’s atmosphere is divided up.
1 ERK 4/16/20
ATMO551a Fall 2010
Some key variables
There are several variables that are key in describing planetary atmospheres. These include the
composition,
gravity
amount of gas present which is closely related to the gravity and surface pressure.
temperature which is tied to first order to the amount of sunlight absorbed,
Note that the temperature varies with the seasons depend on
the tilt of the planet’s spin axis relative to its orbital plane and
the orbital eccentricity which affects how the planet’s distance from the sun varies.
From a dynamics standpoint two other important factors are
rate at which the planet rotates
size of the planet.
Atmospheric composition
A planetary atmosphere is a gas which is a compressible fluid that encompasses at least the outer part of many planets. The gas is made up of different molecules that depend on the planet’s evolutionary history. Earth’s atmosphere is made up of about 78% molecular nitrogen,
N
2
, and 21% molecular oxygen, O
2
and 1% argon, Ar, plus trace species. Water vapor can be present in concentrations ranging anywhere from 0 to 5%. CO
2
is present at about 385 ppmv and is increasing about 2 ppm per year due to fossil fuel burning and other anthropogenic sources.
From Goody & Yung
Mixing ratio Definitions
Volume mixing ratio : number of molecules of a particular species per unit volume divided by the total number of molecules in the air per unit volume
2 ERK 4/16/20
ATMO551a Fall 2010
Mass Mixing ratio : mass density of a particular species divided by the total mass density of the air.
Ideal gas law
The ideal gas law is one of the great achievements of Thermodynamics. It relates the pressure, temperature and density of gases. It is a particular form of the equation of state for a gas. It is VERY close to truth for typical atmospheric conditions. It assumes the molecules collisions interact like billiard balls. Water vapor with its large permanent electric dipole moment, does not quite behave as an ideal gas but even it is close.
The microscopic version of the ideal gas law is
P = N k
B
T (1) where P is pressure in pascals, N is the number density of the gas in molecules per cubic meter and T is the temperature in Kelvin and k
B
is Boltzmann’s constant = 1.38x10
-23
J/K.
For typical atmospheric conditions, N is huge and k
B
is always tiny. So there is a different “macroscopic” version of the ideal gas law with numbers that are easier to work with.
Avogadro’s number is the number of molecules in a “mole” where a mole is defined such that 1 mole of a molecules has a mass in grams equal to the mass of an individual molecule in atomic mass units (amu). For example, 1 mole of hydrogen atoms has a mass of ~1 gram. The number of molecules in a mole is given by Avogadro’s number, N
A
= 6.02214179(30)×10
23
mol
-1
.
We multiply and divide the first equation by N
A
to get
P = N k
B
T = N/N
A
k
B
N
A
T = n R* T where n is the number of moles per unit volume = N / N
A
and R* is the ideal gas constant = k
B
N
A
.
So the macroscopic version of the ideal gas law is
P = n R* T (2) where P is pressure in pascals, n is the number density of the gas in moles per unit volume and T is the temperature in Kelvin and R* is the gas constant = 8.314472 in J/K/mol.
Notice: the ideal gas law equation does not depend on mass .
Now a related point here. For those who are non-atmospheric science types, the universal gas constant is written as R . For Earth atmospheric types, the universal gas constant is written as
R*.
The reason is the following.
If we chose to write the ideal gas law using mass density rather than number density, we multiply and divide the macroscopic form of the equation by mass per mole as follows
P = N R* T = NM R*/M T =
R T (3) where M is the mass of one mole of atmospheric molecules in kg/mole,
is the mass density of the dry Earth atmosphere and R is the dry gas constant for the dry Earth atmosphere. The mass
3 ERK 4/16/20
ATMO551a Fall 2010 of one mole of dry atmosphere (no water vapor) is 28.97 grams = 0.02897 kg. R = R */M = 287
J/K/kg.
This is an approximation to the real atmosphere because water is present such that the mass per mole of air molecules varies depending on how much water vapor is present. This can be dealt with by modifying the mass or by modifying the temperature by creating something called the virtual temperature .
J/K/kg.
As an aside, the equivalent wet gas constant for water vapor is R */ m
H2O
= R v
= 461.9
Writing the gas law more precisely in terms of mass density yields
P = nM/M R* T =
R*/M T =
R T (4) where M is the mass of one mole of gas molecules in kg and R is the gas constant for a particular gas . M is called the mean molecular mass because air in the Earth’s atmosphere is made up of N
2
, O
2
, Ar, H
2
O, CO
2
, etc. The average mass of a mole of dry air is given by the sum of the mass of each molecule times its number fraction in the atmosphere
M
M
n i
M i i n i i
(5)
For Earth, the sum is approximately
M dry
= n%
N2
M
N2
+ n%
O2
M
O2
+ n%
Ar
M
Ar
= 78% 28g/mole + 21% 32 g/mole + 1% 40 g/mole
= 28.96 g/mole
This value of 28.96 g/mole is true for dry air that contains no water vapor in the homosphere.
The homosphere is the part of the atmosphere where turbulence is sufficient to keep the long lived molecules well mixed. The homosphere extends up to the altitude of the homopause (about
100 km) above which turbulence is no longer sufficient to keep the molecules well mixed at higher altitudes, and their concentration with increasing height decays with height by weight.
This upper atmosphere region above the Homosphere is called the Heterosphere.
4 ERK 4/16/20
ATMO551a Fall 2010 from Salby
Strictly speaking the mean molecular mass of air in the homosphere varies because the concentration of the water in the air varies. Since water has a molecular weight of 18 g/mole, which is lighter than 28.96 g/mole, adding water to an air parcel in Earth’s atmosphere lightens it a bit (
In Jupiter’s atmosphere it makes the parcel heavier. Why?
). Therefore, changing the amount of water in the atmosphere will affect on the buoyancy of air parcels. Water can make up as much as 4% of the air molecules in tropical, near-surface conditions. For wet air in the homosphere, the sum is approximately
M wet
= n%
H2O
M
H2O
+ n% dry
M dry
= n%
H2O
18 g/mole + (1 n%
H2O
) 28.97 g/mole
If n%
H2O
= 1.5% then M wet
= 1.5% 18 g/mole + 98.5% 28.97 g/mole = 28.80 g/mole
CO
2
concentrations are also increasing and slightly increasing the mean molecular mass but this is a subtler effect because CO
2
mixing ratios are smaller ~ 385 ppm.
5 ERK 4/16/20
ATMO551a Fall 2010
Gravity
Gravity is a critical variable in understanding planetary atmospheres because the atmosphere is held onto the planet by gravity and compressed under its own weight due to gravity. The larger the gravitational acceleration the more compressed the atmosphere. Small objects with small gravitational acceleration cannot hold onto atmospheres unless the atmospheres are very cold and not very energetic. Otherwise the molecules in the atmospheres will fly off into space.
ASIDE: The reason why the D/H ratio on Mars is so high compared to Earth is thought to be the fact that a large number of hydrogen atoms have flown into space over the lifetime of Mars. The MAVEN mission will measure what is happening right now.
On the other hand, very cold atmospheres may simply condense out into liquid or solids into the surface leaving very few molecules in the gas phase as dictated by the Classius-Clapeyron equation. This equation defines the vapor pressure of a gas in equilibrium over a surface of that same molecule in either the liquid or solid condensed phase. It defines 100% relative humidity on Earth. The thin atmospheres of Mars and Neptune’s large moon Triton and probably Pluto are in vapor pressure equilibrium with ice on their surfaces with their atmospheric pressures depending in large part on the temperature of the ice on the surface. We will discuss the
Classius-Clapeyron equation in far more detail when we discuss humidity and water vapor in
Earth’s atmosphere.
6 ERK 4/16/20
ATMO551a Fall 2010
Pressure, density & temperature for US Standard Atmosphere, from Salby
The vertical pressure structure of the atmosphere.
Gravity and the compressibility of gases combine to make the vertical length scale of the atmosphere much smaller than its horizontal length scales. As a result, the pressure and density of atmospheres decrease approximately exponentially with altitude. The rapidness of that decrease with altitude depends on gravity, temperature and the composition of the atmosphere.
Specifically, the variation of pressure, P , with altitude, z , can be written approximately as
P(z) ~ P(0) e
–z/H
(6)
Where, as we will derive in a moment, the pressure scale height, H , equals R*T/mg where R * is the ideal gas constant, T is the atmospheric temperature in K, m is the mean molecular mass of the gas in kg/mole and g is the gravitational acceleration.
Hydrostatic Equilibrium
If we stop for a moment to think about it, gravity is continually pulling the atmosphere down toward the surface and yet the atmosphere is not in continuous free fall, like water in a waterfall, accelerating rapidly down toward the surface. This means there must be a force pushing the atmosphere upward that is counterbalancing the downward force of gravity. The missing upward force is associated with atmospheric pressure.
To first order, the gas pressure at the bottom of an atmospheric column balances the downward force of gravity on the column. This is called hydrostatic balance. Remember from
Newton’s second law that Force equals mass times acceleration,
F = m a . In the case of gravity, a = g . If we think about an infinitesimally thick layer of atmosphere of vertical thickness, dz, and area, A . The mass density of the layer is
so that the mass of that layer is dm =
A dz . The gravitational force on that layer is therefore F g
= g
A dz .
To balance the downward gravitational force on this infinitesimally thick layer, the pressure at the bottom of the layer must be higher than the pressure at the top of the layer such that it
7 ERK 4/16/20
ATMO551a Fall 2010 balances the downward force of gravity on the layer. Since pressure is force per unit area, the pressure at the bottom of the layer must be higher than the pressure at the top of the layer by an amount such that dP ( z ) A = F g
= -g
A dz
So the equation for hydrostatic balance is dP ( z ) = -g ( z )
( z ) dz (7) where P is pressure of the air, z is height, g is the gravitational acceleration and
is mass density of the air. This means that as you add a layer of atmosphere of density
, that is dz thick, the pressure at the bottom of the layer is higher than the pressure at the top of the layer by dP . The minus sign represents the fact that gravity is pulling down while the component of pressure that is balancing gravity is pointing upward.
Units
Consider the units on the right side. We will normally evaluate equations in mks units. g has units of acceleration: m/s
2
.
is mass density and has mks units of kg/m
3
. dz is an increment in height and has units of m. Therefore the right hand side of the equation has units of kg m/s
2
/m
2
which are units of force per unit area. Pressure is defined as force per unit area so from a units’ standpoint, the equation is correct.
The mks units of force per unit area are kg m/s
2
per m
2
which is called a ‘pascal’ or Pa for short. In atmospheric science, pressure units are typically bars or millibars. The conversion is 1 mb = 100 pascals. 1 bar = 1000 mb ~ 1 ‘atmosphere’ because the average surface pressure of
Earth’s atmosphere is 1013 mb.
Taking the mass form of the ideal gas law
P
RT
(8) and plugging it into (7) yields dP ( z ) g
RT
Pdz
g ( z ) M ( z )
R * T ( z )
P ( z ) dz
Rewriting this yields
dP d ln
P
M z
R * T z
dz (9)
Pressure Scale Height
By simple units analysis, we see that R*T / Mg must be a length scale. We call this H ( z ) = H
P
( z ) =
R*T/Mg the pressure scale height. dP
P
d ln
M z
R * T z
dz
dz
(10)
Integrating (10) we get
8 ERK 4/16/20
ATMO551a Fall 2010
P ( z
2
)
P ( z
1
)exp
z
1
z
2 d
H (
)
(11)
Assuming for the moment that H is constant over some height intervals, then the integral yields
exp
z
2
z
1
H
(12)
So pressure decays approximately exponentially with altitude with a scale height of H .
A typical pressure scale height in the mid-troposphere is approximately
8.3 x 250 /0.02896 /9.81 ~ 7,000 m = 7 km.
At the surface where temperatures are higher, pressure scale heights are ~8 km.
Note that the warmer the atmosphere is, the larger H is which causes pressure to decay more slowly with altitude. At lower temperatures, H is smaller and pressure decays more rapidly with altitude.
Pressure height as a thermometer : Therefore, accurately measuring the height of a pressure surface can provide a very accurate measure of the average temperature at lower altitudes which can be quite useful for observing climate change.
Winds : This also means that when a warm air mass sits next to a cold air mass, the pressures aloft will be higher over the warm air mass causing a horizontal pressure gradient aloft.
At latitudes greater than about 10 o
, this pressure gradient will cause a wind. So the ability to remote sense such horizontal pressure gradients yields an indirect measure of winds.
Strictly speaking the vertical pressure structure is exactly exponential only if atmospheric temperature does not change with altitude (‘ isothermal’ ), but the exponential behavior is crudely true because atmospheric temperatures only vary from ~200K to 300K.
Another subtlety is that g decreases gradually with altitude. We’ll go through this more when we dicuss gravity in more detail.
Pressure as a vertical coordinate: Pressure decreases monotonically with altitude and so can be used as a vertical coordinate and in fact is used as such in equations describing atmospheric dynamics because it simplifies the equations. Passive nadir sounders, that is atmospheric sounders that measure thermal emission from the atmosphere determine temperature and atmospheric composition and winds as a function of pressure, not altitude, based on the spectral width of absorption lines that depends on pressure as we shall see shortly.
Approximate Pressure versus altitude
The height of a pressure surface depends on the surface pressure and the average temperature of the atmosphere between the surface and the pressure level. There is an average or typical relation between pressure and altitude which is useful for going back and forth between pressure and altitude approximately.
Pressure altitude above mean sea level (msl)
9 ERK 4/16/20
ATMO551a Fall 2010
100 mb
200 mb
300 mb
500 mb
16 km
12 km
9 km
5.5 km
700 mb
800 mb
900 mb
1000 mb
3 km
2 km
1 km
0 km
At colder temperatures the pressures will correspond to somewhat lower altitudes. At higher temperatures, the pressures will correspond to slightly higher altitudes.
Temperature change with altitude
Because temperatures generally decrease with altitude in the troposphere, the term temperature lapse rate has been defined where lapse rate = -d T / dz .
The dry adiabatic temperature lapse rate is g/C p
~ 10K/km. Adiabatic means that as an air parcel is lifted or sinks, there is no heat exchanged with the environment. EvZ gives the derivation.
Except right at the surface, the dry adiabat is the most extreme temperature decrease with altitude that is physically permissible. If the decrease in temperature with altitude were to become momentarily even more extreme, then the atmosphere will correct because lighter air sits below denser air and any perturbation will cause the atmosphere to turn over (hot air rising and cold air sinking) and correct back to the dry adiabat. This causes turbulence.
Usually vertical temperature gradients in the atmosphere are more stable because of 2 reasons. First, latent heat released as water vapor condenses out of the air as air cools as it rises makes the temperature decrease with altitude smaller. Second, except in convection, most sinking air sinks rather slowly, losing energy radiatively as it sinks. So as it sinks it compressionally heats but loses energy as well so it warms at a slower vertical rate than the dry adiabat.
When in doubt, the standard vertical termperature gradient in the troposphere is -6.5 K/km.
In the stratosphere, temperatures generally increase with altitude.
10 ERK 4/16/20
ATMO551a Fall 2010
Average vertical temperature structure of Earth’s atmosphere
Linear change in temperature with altitude
It is useful to note for more quantitative applications, a more accurate equation for pressure versus altitude can be written for short vertical intervals over which temperature varies linearly with altitude.
T ( z
2
) = T ( z
1
) + d T/ d z ( z
2
-z
1
)
So, over an altitude interval where changes in temperature are linearly proportional to changes in altitude we can substitute changes in T for changes in z . Defining d T/ d z = , we get from (5) d ln ( P ( z )) = -g ( z ) M ( z ) /(RT ( z )) d z =-g ( z ) m ( z ) /( RT ( z ))/ T d T
If the interval is short we can assume g and M do not change over the vertical interval so that d ln
gm dT
R
Ý
T
gm
R
Ý d ln
(13) ln
P
2
P
1
gm
R ln
T
2
T
1
11 ERK 4/16/20
ATMO551a Fall 2010
Raising each side to exp gives
P
2
P
1
exp
gM
R * Ý ln
T
2
T
1
T
1
T
2
gM
R * Ý
T
1
T
2
gM
R * Ý
(14)
So we have a power law relation between P and T (or equivalently changes in altitude) over intervals where the vertical temperature gradient (=
temperature lapse rate) is constant and the
=0, we have an isothermal atmosphere and then the exponential form is exactly correct.
To estimate – gM/R , assume a typical lapse rate of 6.5 K/km. (Be warned, the “lapse rate” is
– gM/R = 9.81x0.02897/8.3144/0.0065 ~ 10x3x10
-2 x1.2x10
-1
/6.5x10
-3
~ 0.5x10
1-2-1+3
= 5.
Assume T
1
= 250K and T
2
= 243.5K (1 km higher) and the pressure P
1
= 500 mb. Then P
2
=
500mb (243.5/250)
5
= 435 mb.
Had we used the exponential form using the average temperature between the two levels so the pressure scale height would be RT/mg = 7.2 km, the answer would have been 500mb exp(-
1/7.2) = 435 mb.
So the difference is subtle but for precise determinations of pressure versus altitude, this power law relation is more accurate. Note that for wind determination, we want to know pressure versus height to a few meters if possible.
Density scale height
When temperature varies with altitude, one can derive a density scale height:
H
1
H
P dT H
P dz T
So, in the troposphere where dT/dz <0, the density scale height is larger than the pressure scale height (as much as ~13 km with an adiabatic lapse rate and warm conditions at the surface). So
the density scale height is smaller than the pressure scale height and so density decreases more rapidly with altitude than pressure.
12 ERK 4/16/20
