ANALYTICAL METHODS
advertisement
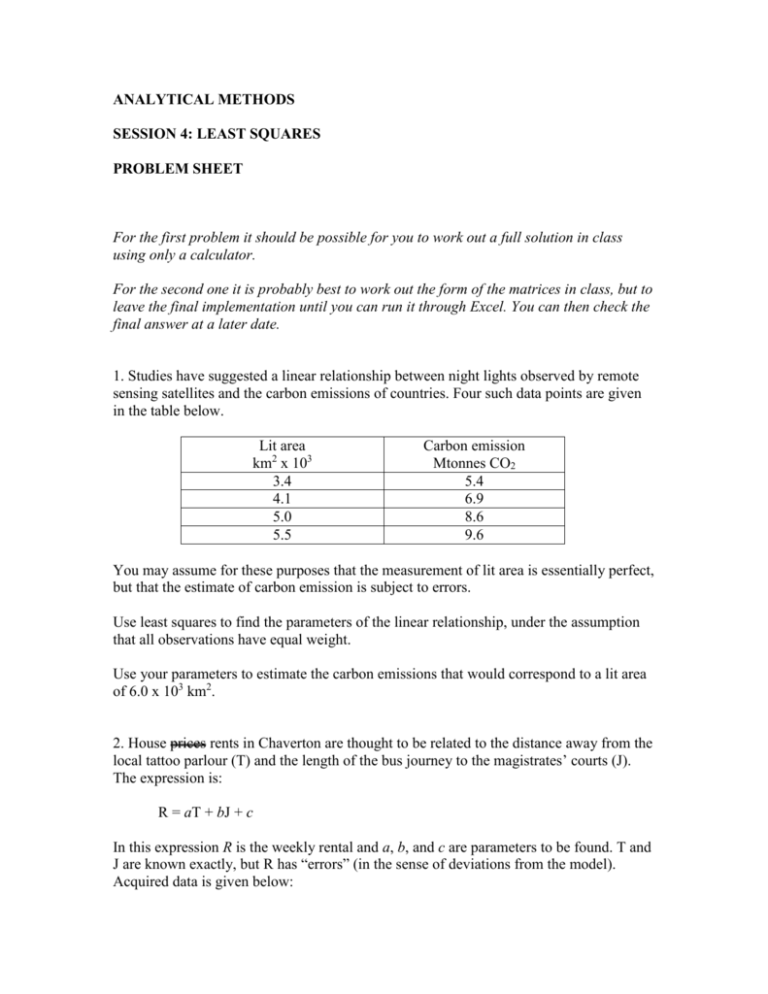
ANALYTICAL METHODS SESSION 4: LEAST SQUARES PROBLEM SHEET For the first problem it should be possible for you to work out a full solution in class using only a calculator. For the second one it is probably best to work out the form of the matrices in class, but to leave the final implementation until you can run it through Excel. You can then check the final answer at a later date. 1. Studies have suggested a linear relationship between night lights observed by remote sensing satellites and the carbon emissions of countries. Four such data points are given in the table below. Lit area km2 x 103 3.4 4.1 5.0 5.5 Carbon emission Mtonnes CO2 5.4 6.9 8.6 9.6 You may assume for these purposes that the measurement of lit area is essentially perfect, but that the estimate of carbon emission is subject to errors. Use least squares to find the parameters of the linear relationship, under the assumption that all observations have equal weight. Use your parameters to estimate the carbon emissions that would correspond to a lit area of 6.0 x 10³ km2. 2. House prices rents in Chaverton are thought to be related to the distance away from the local tattoo parlour (T) and the length of the bus journey to the magistrates’ courts (J). The expression is: R = aT + bJ + c In this expression R is the weekly rental and a, b, and c are parameters to be found. T and J are known exactly, but R has “errors” (in the sense of deviations from the model). Acquired data is given below: Weekly rental (£) 190 144 108 123 165 100 T (m) 100 300 500 400 200 500 J (mins) 18 5 15 6 10 5 Working under the assumption that all data is observed with an accuracy of £1, find the best estimates of a, b, and c by least squares. When you have found these, work out a better estimate of the accuracy of the observational data.
