pce12045-sup-0001-si
advertisement
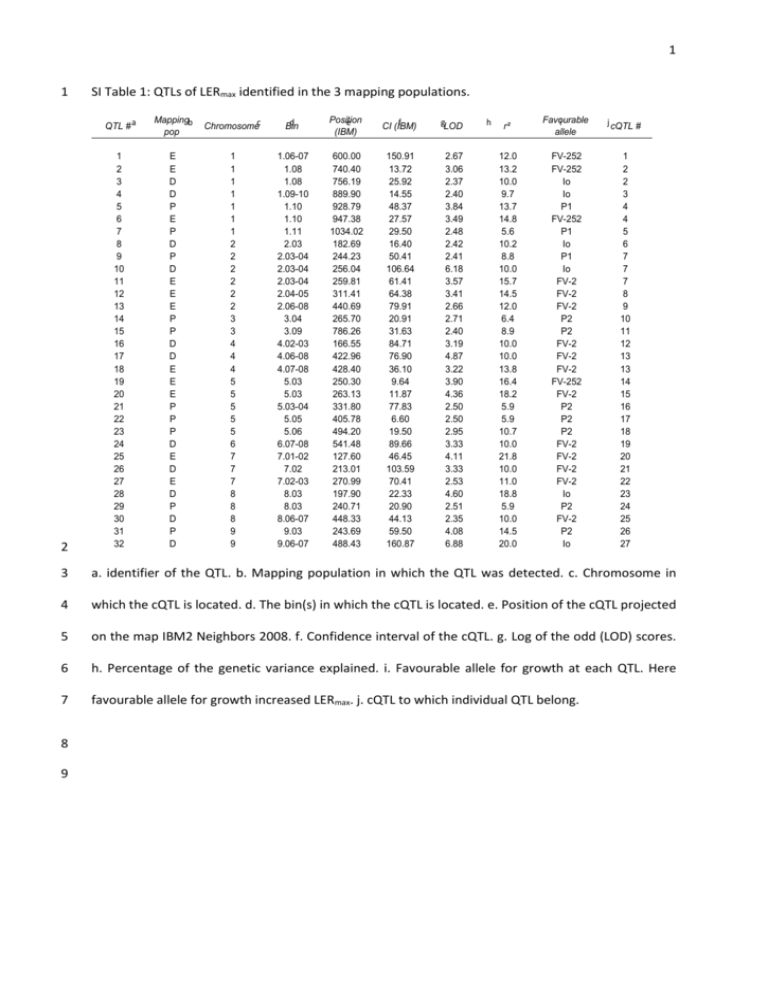
1 1 2 SI Table 1: QTLs of LERmax identified in the 3 mapping populations. QTL # a Mappingb pop Chromosomec d Bin Position e (IBM) f CI (IBM) gLOD 1 2 3 4 5 6 7 8 9 10 11 12 13 14 15 16 17 18 19 20 21 22 23 24 25 26 27 28 29 30 31 32 E E D D P E P D P D E E E P P D D E E E P P P D E D E D P D P D 1 1 1 1 1 1 1 2 2 2 2 2 2 3 3 4 4 4 5 5 5 5 5 6 7 7 7 8 8 8 9 9 1.06-07 1.08 1.08 1.09-10 1.10 1.10 1.11 2.03 2.03-04 2.03-04 2.03-04 2.04-05 2.06-08 3.04 3.09 4.02-03 4.06-08 4.07-08 5.03 5.03 5.03-04 5.05 5.06 6.07-08 7.01-02 7.02 7.02-03 8.03 8.03 8.06-07 9.03 9.06-07 600.00 740.40 756.19 889.90 928.79 947.38 1034.02 182.69 244.23 256.04 259.81 311.41 440.69 265.70 786.26 166.55 422.96 428.40 250.30 263.13 331.80 405.78 494.20 541.48 127.60 213.01 270.99 197.90 240.71 448.33 243.69 488.43 150.91 13.72 25.92 14.55 48.37 27.57 29.50 16.40 50.41 106.64 61.41 64.38 79.91 20.91 31.63 84.71 76.90 36.10 9.64 11.87 77.83 6.60 19.50 89.66 46.45 103.59 70.41 22.33 20.90 44.13 59.50 160.87 2.67 3.06 2.37 2.40 3.84 3.49 2.48 2.42 2.41 6.18 3.57 3.41 2.66 2.71 2.40 3.19 4.87 3.22 3.90 4.36 2.50 2.50 2.95 3.33 4.11 3.33 2.53 4.60 2.51 2.35 4.08 6.88 h r² Favourable i allele j cQTL # 12.0 13.2 10.0 9.7 13.7 14.8 5.6 10.2 8.8 10.0 15.7 14.5 12.0 6.4 8.9 10.0 10.0 13.8 16.4 18.2 5.9 5.9 10.7 10.0 21.8 10.0 11.0 18.8 5.9 10.0 14.5 20.0 FV-252 FV-252 Io Io P1 FV-252 P1 Io P1 Io FV-2 FV-2 FV-2 P2 P2 FV-2 FV-2 FV-2 FV-252 FV-2 P2 P2 P2 FV-2 FV-2 FV-2 FV-2 Io P2 FV-2 P2 Io 1 2 2 3 4 4 5 6 7 7 7 8 9 10 11 12 13 13 14 15 16 17 18 19 20 21 22 23 24 25 26 27 3 a. identifier of the QTL. b. Mapping population in which the QTL was detected. c. Chromosome in 4 which the cQTL is located. d. The bin(s) in which the cQTL is located. e. Position of the cQTL projected 5 on the map IBM2 Neighbors 2008. f. Confidence interval of the cQTL. g. Log of the odd (LOD) scores. 6 h. Percentage of the genetic variance explained. i. Favourable allele for growth at each QTL. Here 7 favourable allele for growth increased LERmax. j. cQTL to which individual QTL belong. 8 9 2 10 SI Table 2: QTLs of final leaf length identified in the 3 mapping populations. QTL # a 1 2 3 4 5 6 7 8 9 10 11 12 13 14 15 16 Mapping b Chromosomec pop P P P D D D P P D D D D D P D P 1 1 2 2 2 3 3 3 4 4 5 6 8 8 9 10 d Bin Position e (IBM) f CI (IBM) g LOD 1.04-07 1.07-09 2.03-04 2.04 2.05-06 3.04-05 3.04 3.09 4.03 4.06-07 5.04-05 6.07-08 8.02 8.05-06 9.06-07 10.00-10.01 523.90 752.27 239.99 283.09 369.30 259.40 265.70 764.73 168.25 386.55 388.68 573.30 145.24 371.37 502.92 34.80 250.76 200.42 38.94 60.15 49.45 88.20 54.10 50.26 48.67 56.04 39.74 73.46 29.12 40.80 105.23 6.50 4.11 4.60 3.96 4.50 3.06 4.46 4.55 4.17 4.80 3.77 3.39 4.80 6.62 3.21 4.54 3.06 h r² 14.60 16.20 14.10 13.20 12.00 15.40 16.00 14.80 16.40 11.10 13.80 16.40 19.40 11.60 15.40 11.10 Favourable i allele j cQTL # P2 P1 P1 FV-2 FV-2 Io P2 FV-2 FV-2 Io FV-2 Io P1 Io P2 1 2 3 3 4 5 5 6 7 8 9 10 11 12 13 14 11 12 a. identifier of the QTL. b. Mapping population in which the QTL was detected. c. Chromosome in 13 which the cQTL is located. d. The bin(s) in which the cQTL is located. e. Position of the cQTL projected 14 on the map IBM2 Neighbors 2008. f. Confidence interval of the cQTL. g. Log of the odd (LOD) scores. 15 h. Percentage of the genetic variance explained. i. Favourable allele for growth at each QTL. Here 16 favourable allele for growth increased the final length of the 6th leaf. j. cQTL to which individual QTL 17 belong. 18 3 19 SI Table 3: NILs tested in different cQTLs and their significance. Name a 20 21 22 Effect on h leaf elongation rate Effect ion final leaf length -13% *** -11% ** e Bin Position f (IBM) g CI (IBM) 2 2.04 297 85 2 2.06-07 410 69 -3% 4% CML444 5 5.01-02 147 99 -5% -2% CML444 8 8.01-02 115 26 1% 5% Dent 1 1.08-09 828 82 2% 11% Recurrentb Donorc d Chromosome ABLT_1 F252 CML444 ABLT_2 F252 CML444 ABLT_3 F252 ABLT_4 F252 NILD_75 Flint NILF_76 Dent Flint 1 1.08-09 828 82 7% -4% NILD_88 Flint Dent 1 1.07-10 839 247 -3% 1% NILD_77 Flint Dent 4 4.01-02 52 73 -7% NILF_78 Dent Flint 4 4.01-02 52 73 NILD_79 Flint Dent 4 4.06-07 400 77 NILF_80 Dent Flint 5 5.02-03 208 NILF_81 Dent Flint 5 5.03-04 301 NILD_82 Flint Dent 7 7.02 174 NILD_83 Flint Dent 8 8.01 NILF_84 Dent Flint 8 -19% *** cQTL Leaf j elongation rate # cQTL Final k length leaf # 7-8 3L 12 - 4% -17% * -4% 2% 99 0% -1% 154 -4% -3% 76 -4% 6% 61 112 -5% 4% 8.05-07 434 116 -7% -6% NILF_86 Dent Flint 8 8.01 105 11 -4% NILD_85 Flint Dent 8 8.01-02 114 18 -20% * -11% NILF_87 Dent Flint 9 9.02 157 36 0% -2% NILSyn_1 B73 CML333 1 1.03 242 75 -15% * NA NILSyn_2 B73 CML247 1 1.09-10 910 83 -12% NA NILSyn_3 B73 CML333 1 1.09-10 910 83 -15% * NA NILSyn_4 B73 CML333 1 1.09-10 910 83 -12% NA NILSyn_5 B73 Oh43 1 1.10-11 928 43 -16% * NILSyn_6 B73 Tzi8 1 1.10-11 982 151 -15% ** -17% 4 NILSyn_7 B73 NC358 1 1.12 1146 7 -20% * -15% 5 NILSyn_8 B73 Tx303 2 2.02-03 121 96 -12% * NA 6 NILSyn_9 B73 Tzi8 2 2.02 138 2 -4% 12% NILSyn_10 B73 M162W 2 2.02-03 138 60 2% 13% NILSyn_11 B73 CML277 2 2.02-03 153 30 11% * 12% NILSyn_12 B73 CML333 2 2.02-03 153 30 8% 10% NILSyn_13 B73 Ki3 2 2.02-03 153 30 9% 11% NILSyn_14 B73 CML103 2 2.02-03 153 30 14% 16% NILSyn_15 B73 MO17 2 2.02-03 157 22 -3% NA NILSyn_16 B73 CML228 2 2.03 167 3 13% 12% NILSyn_17 B73 Oh43 2 2.02-05 227 230 -13% NA NILSyn_18 B73 Ki11 2 2.03 232 2 -14% ** NILSyn_19 B73 NC358 2 2.03 232 2 -8% NILSyn_20 B73 CML322 2 2.03-04 234 138 4% 16% NILSyn_21 B73 Mo18W 2 2.02-05 244 196 -17% * -18% NILSyn_22 B73 NC358 3 3.07-09 692 249 1% -8% NILSyn_23 B73 Tx303 4 4.02 94 2 -15% NA NILSyn_24 B73 CML247 4 4.02 94 2 -12% NA NILSyn_25 B73 CML322 4 4.02 94 2 -10% * NA 12 NILSyn_26 B73 Ki3 4 4.02 94 2 -11% * NA 12 NILSyn_27 B73 MO17 4 4.02 94 2 -24% NILSyn_28 B73 MO17 4 4.02 94 2 -16% ** NILSyn_29 B73 Oh43 4 4.02 94 2 -11% NILSyn_30 B73 CML52 4 4.03 155 20 -13% * NA NA NA 23 3 3-4 6 7 -10% 6-7-8 -21% ** NA 12 -11% NA 12 4 23 SI Table 3: continues Name 24 25 26 a Recurrent b c Donor d Chromosome e Bin Position f (IBM) g CI (IBM) Effect on h leaf elongation rate Effect on i final leaf length NILSyn_31 B73 CML322 5 5.02-03 195 5 -7% NILSyn_32 B73 NC350 5 5.02-03 205 63 8% -1% NILSyn_33 B73 NC350 5 5.02-03 205 63 -18% * -20% NILSyn_34 B73 Ki3 5 5.02-03 227 69 2% -9% NILSyn_35 B73 Ki11 5 5.03 236 2 -16% -21% NILSyn_36 B73 Tx303 5 5.02-03 242 99 -7% -12% NILSyn_37 B73 CML103 5 5.03 249 25 -7% -14% NILSyn_38 B73 CML228 5 5.03-04 254 113 -6% NA NILSyn_39 B73 CML228 5 5.03-04 254 113 -2% -5% NILSyn_40 B73 CML322 5 5.02-04 261 137 -16% ** -14% NILSyn_41 B73 Tzi8 5 5.03 261 2 8% 17% NILSyn_42 B73 CML333 5 5.03-04 283 93 -5% -12% NILSyn_43 B73 CML333 5 5.03-04 283 93 0% -7% NILSyn_44 B73 CML69 5 5.03-04 283 93 1% -8% NILSyn_45 B73 Oh43 5 5.03-04 310 38 -4% NA NILSyn_46 B73 Tzi8 5 5.03-04 310 38 -16% -16% NILSyn_47 B73 CML103 5 5.03-04 310 38 -11% -15% NILSyn_48 B73 M162W 5 5.03-05 343 103 -10% -15% * NILSyn_49 B73 CML277 5 5.05 391 7 -8% -8% NILSyn_50 B73 NC350 5 5.05 391 7 0% -9% NILSyn_51 B73 CML52 5 5.05 392 3 -3% -14% NILSyn_52 B73 CML103 5 5.05 392 3 -9% -17% NILSyn_53 B73 Ki11 5 5.05 418 62 -18% ** NILSyn_54 B73 NC358 5 5.05 418 62 9% 14% NILSyn_55 B73 NC358 5 5.05 418 62 -9% -11% NILSyn_56 B73 CML52 5 5.05 449 2 NILSyn_57 B73 MO17 5 5.06 479 19 3% NILSyn_58 B73 MO17 5 5.06 479 19 -11% NILSyn_59 B73 Oh43 5 5.06 479 19 -16% * -12% NILSyn_60 B73 Ki3 5 5.06 502 16 -6% -8% NILSyn_61 B73 NC350 5 5.06 502 16 -16% * NILSyn_62 B73 CML247 5 5.06 510 2 -21% *** NILSyn_63 B73 Mo18W 5 5.06-07 513 87 5% 3% NILSyn_64 B73 Tx303 5 5.06-07 513 87 -7% -11% * NILSyn_65 B73 Tx303 5 5.06-07 525 63 3% 7% NILSyn_66 B73 CML228 5 5.06-07 533 48 -12% * -9% NILSyn_67 B73 CML52 5 5.03-04 295 + 392 68 + 3 -1% -11% NILSyn_68 B73 CML333 9 9.06 460 2 -11% * NA NILSyn_69 B73 CML228 9 9.06 480 39 -9% NA NILSyn_70 B73 CML247 9 9.06 480 39 -17% NA NILSyn_71 B73 CML52 9 9.06 480 39 -11% * NILSyn_72 B73 NC350 9 9.06 480 39 -6% -14% NILSyn_73 B73 NC350 9 9.06 480 39 -10% NA NILSyn_74 B73 CML322 9 9.06-07 529 137 -11% NA NILSyn_75 B73 CML333 9 9.06-07 529 137 -11% NILSyn_76 B73 Oh43 9 9.06-07 529 137 -25% *** -19% *** cQTL Leaf j elongation rate # cQTL k Final leaf length # -16% NA -22% 14 14-15 9L 17 18 14% -8% 18 NA 18 -23% ** 18 NA - 18 27 27 NA -20% ** 27 13L 5 27 SI Table 3: continues Name a Recurrent b c Donor d Chromosome e Bin Position f (IBM) g CI (IBM) Effect on h leaf elongation rate Effect ion final leaf length NILG_54 B73 Gaspe 1 1.06-08 653 260 -4% -6% NILG_55 B73 Gaspe 1 1.07-09 722 191 4% -13% NILG_56 B73 Gaspe 1 1.10-11 963 150 11% 5% NILG_57 B73 Gaspe 2 2.00-03 95 220 5% -2% NILG_61 B73 Gaspe 2 2.04-08 409 185 -7% -3% NILG_63 B73 Gaspe 4 4.01-02 47 93 -15% * -6% NILG_64 B73 Gaspe 5 5.00 21 42 1% 1% NILG_65 B73 Gaspe 5 5.02-04 247 167 -24% ** -7% NILG_66 B73 Gaspe 5 5.04-05 365 51 4% 3% NILG_67 B73 Gaspe 8 8.01-03 116 202 -12% -5% NILG_69 B73 Gaspe 8 8.02-03 182 94 -2% -2% NILG_70 B73 Gaspe 8 8.02-03 197 80 -2% -4% NILG_71 B73 Gaspe 9 9.01-05 198 261 11% 3% NILG_72 B73 Gaspe 9 9.02-05 235 224 32% *** 4% cQTL Leaf j elongation rate # cQTL k Leaf length # 12 14-15 26 28 29 a. Identifiers of the introgression lines from the four populations NILG, NILF,D, ABLT and NILSyn. b. 30 Genetic background of the NIL. c. Donor line from which the introgression originates. d. Chromosome 31 in which the introgressed fragment is located. e. Bin(s) in which the introgression is located. f. Central 32 position of the introgression on the map IBM2 Neighbors 2008. g. Length of the introgression. h. 33 Effect of the introgressed fragment on LERmax relatively to the recurrent phenotype and its 34 significance. *, ** and ***, p-values smaller than 0.05, 0.01 and 0.001 respectively. i. Effect of the 35 introgressed fragment on final leaf length relatively to the recurrent phenotype and its significance. j. 36 cQTL in which significant NILs for LERmax are introgressed. k. cQTL in which significant NILs for final 37 leaf length are introgressed. 38 39 40 6 41 42 SI Table 4: Individual QTLs of growth of reproductive organs (ear dry weight, silk dry eight and ASI), plant height and anthesis in the field, projected on the genetic map of population P. Trait a 43 44 Anthesis Anthesis Anthesis Anthesis Anthesis Anthesis Anthesis Anthesis Anthesis Anthesis Anthesis Anthesis Anthesis Anthesis Anthesis Anthesis ASI ASI ASI ASI ASI ASI ASI ASI ASI ASI ASI ASI ASI ASI ASI ASI ASI ASI ASI ASI Ear Dry Weight Ear Dry Weight Ear Dry Weight Ear Dry Weight Ear Dry Weight Silk Dry Weight Silk Dry Weight Silk Dry Weight Locationb TL96B TL99A TL99A TL04B TL99A TL96B TL04B TL99A TL04B TL04B TL96B TL99A TL04B TL04B TL99A TL04B TL99A TL04B TL04B TL99A TL96B TL04B TL96B TL99A TL99A TL96B TL96B TL04B TL04B TL99A TL96B TL04B TL99A TL96B TL99A TL96B TL04B TL04B TL04B TL04B TL04B TL04B TL04B TL04B c Positiond (P) Chromosome 2 2 4 4 4 4 4 4 4 6 6 6 8 9 9 9 1 1 2 2 2 3 3 3 5 5 6 6 7 7 7 7 10 10 10 10 1 2 6 6 9 1 6 8 97.00 155.00 7.00 110.00 112.00 114.00 145.00 146.00 203.00 28.00 118.00 121.00 55.00 118.00 124.00 132.00 251.00 253.00 81.00 86.00 87.00 184.00 185.00 289.00 132.00 134.00 101.00 112.00 86.00 123.00 125.00 132.00 54.00 60.00 141.00 157.00 254.00 57.00 62.00 103.00 70.00 256.00 111.00 153.00 e CI(P) f LOD 40.00 40.00 27.00 40.00 40.00 40.00 40.00 40.00 40.00 40.00 40.00 40.00 40.00 40.00 40.00 40.00 40.00 40.00 40.00 40.00 40.00 40.00 40.00 40.00 40.00 40.00 40.00 40.00 40.00 40.00 40.00 40.00 40.00 40.00 40.00 40.00 40.00 40.00 40.00 40.00 40.00 40.00 40.00 40.00 2.66 4.30 3.26 4.45 2.53 4.40 4.24 2.40 2.22 2.49 2.06 2.85 2.40 2.81 2.73 2.11 2.86 2.46 3.08 4.44 4.19 2.94 2.12 2.33 2.85 2.08 1.90 6.94 2.51 4.82 7.09 3.92 3.29 2.29 2.40 1.87 4.20 2.38 2.45 3.94 3.47 2.81 3.83 2.25 g r² 5.31 5.39 4.42 13.93 6.32 11.05 8.39 4.48 2.80 2.93 4.83 4.47 1.57 5.64 6.16 2.91 3.26 3.24 5.82 6.12 7.12 2.85 1.32 1.74 5.09 3.67 3.87 12.21 4.96 8.11 11.32 6.67 4.75 3.14 3.44 1.00 7.31 5.72 4.27 4.75 6.33 6.86 8.10 2.82 Additive h value Favourable i allele 0.58 -1.04 -0.83 0.82 0.78 0.82 0.75 0.74 -0.51 0.55 -0.46 0.91 -0.58 -0.55 -0.80 -0.56 0.39 0.27 -0.30 -0.54 -0.40 -0.27 -0.25 -0.35 0.50 0.30 -0.26 -0.45 0.28 0.53 0.49 0.34 -0.49 -0.31 0.42 0.24 -0.05 0.04 0.04 0.05 0.05 -0.03 0.03 0.02 P2 P1 P1 P2 P2 P2 P2 P2 P1 P2 P1 P2 P1 P1 P1 P1 P1 P1 P2 P2 P2 P2 P2 P2 P1 P1 P2 P2 P1 P1 P1 P1 P2 P2 P1 P1 P1 P2 P2 P2 P2 P1 P2 P2 7 45 46 SI Table 4: Continues. Trait a Locationb PLHT PLHT PLHT PLHT PLHT PLHT PLHT PLHT PLHT PLHT PLHT PLHT PLHT PLHT PLHT PLHT PLHT PLHT TL04B TL04B TL04B TL04B TL04B TL04B TL96B TL96B TL96B TL96B TL96B TL96B TL99A TL99A TL99A TL99A TL99A TL99A c Positiond(P) Chromosome 4 4 4 4 4 8 1 2 4 5 6 9 3 3 4 6 8 9 13 155 172 155 172 81 259 81 174 155 183 68 29 102 239 0 88 118 e CI(P) f LOD 40 40 40 40 40 40 40 40 40 40 40 40 40 40 31 40 40 40 2.07 2.42 2.00 2.42 2.00 2.74 1.94 4.96 4.34 2.45 3.02 3.27 3.94 3.13 3.56 2.11 5.54 2.14 g r² 3.44 5.76 6.31 5.76 6.31 4.47 4.31 4.44 9.59 5.16 5.88 3.15 6.78 3.95 4.56 4.73 5.58 6.15 Additive h value Favourable i allele -2.85 3.05 3.25 3.05 3.25 -4 3.08 4.82 4.82 3.36 4.1 -3.91 -4.41 -4.42 4.25 -3.51 -5.23 -3 P2 P2 P2 P1 P1 P2 P1 P1 P1 P1 P1 P2 P2 P2 P1 P2 P2 P2 47 a. Measured trait. b. Location, TL: Tlatizapan, 96, 99, 04: year 1996, 1999, 2004, A, B: growing season. 48 c. The chromosome in which the QTL is located. d. Position of the QTL on the genetic map of the 49 population P. e. Confidence interval of the QTL. g. Log of the odd (LOD) scores. h. Percentage of the 50 genetic variance explained by the QTL. i. Favourable allele for growth at each QTL. For example 51 favourable allele for growth increased LERmax and decreased ASI. For anthesis, the presented allele is 52 the one that reduced the vegetative period. 53 8 54 SI Table 5: Individual QTLs of growth of vegetative organs (leaf, root and shoot) and their reference in 55 the literature, projected on the map IBM2 Neighbors 2008. Mapping a population Traitb c Chromosome dBin Position e (IBM) f CI (IBM) g LOD D D D D D D D D D D D D D D D D D D D D D D D D E E E E E E E E E P P P P P P P P P P P P P P P P Internode 8 diameter Internode 8 diameter Internode 8 diameter Internode 8 diameter Internode 8 diameter Internode 8 length Internode 8 length Internode 8 length Leaf length 4 Leaf length 4 Leaf length 4 Leaf length 4 Root diameter at internode 7 Root diameter at internode 7 Root diameter at internode 7 Shoot Dry Weight Shoot Dry Weight Silking date Silking date Silking date Silking date Silking date Silking date Silking date Silking date Silking date Silking date Silking date Silking date Silking date Silking date Silking date Silking date Axile Root Length Axile Root Length Axile Root Length Elongation rate of axile root Elongation rate of axile root Elongation rate of axile root Elongation rate of lateral Root Lateral Root Length Lateral Root Length Leaf area Leaf area Root Dry weight Shoot Dry Weight Shoot Dry Weight Total Root Length Total Root Length 4 4 5 5 7 2 4 5 4 5 6 7 2 4 5 4 8 1 1 5 8 10 10 10 1 2 5 8 8 8 9 9 10 2 3 7 2 3 5 6 2 3 2 8 2 2 9 2 3 4.02-03 4.06-09 5.02-03 5.05-06 7.02-03 2.04-07 4.03-05 5.05 4.07 5.05-06 6.07-08 7.01-02 2.02-03 4.02-04 5.06 4.06-07 8.06-07 1.06 1.08-09 5.03 8.02-03 10.03-04 0.00 10.05-06 1.09 2.03 5.02 8.05-06 8.06 8.07 9.02-03 9.07 10.07 2.01-02 3.05-06 7.05-06 2.01-02 3.04-06 5.01-02 6.04-05 2.01-02 3.06 2.00-02 8.01-03 2.01-02 2.01-02 9.02-03 2.00-02 3.05-06 152.90 483.31 197.51 453.94 277.81 377.99 224.64 404.90 415.72 460.92 574.65 137.76 164.80 184.46 498.14 367.20 473.78 529.20 790.84 260.00 152.16 255.01 305.28 375.95 861.56 204.33 184.20 369.63 435.63 467.02 167.28 590.55 500.00 51.30 361.10 602.62 58.99 351.26 163.11 275.98 28.13 429.39 76.22 153.30 63.08 92.94 164.44 31.76 414.00 85.73 202.78 39.60 54.13 67.70 86.15 52.37 33.24 25.07 37.59 109.46 61.98 12.03 107.10 38.42 73.01 40.90 43.33 51.63 40.00 40.00 40.00 30.29 40.00 32.00 48.71 17.54 58.22 11.31 9.58 101.52 90.38 89.00 75.81 88.59 63.51 86.74 132.82 59.58 91.26 47.97 69.48 148.20 78.09 106.59 139.25 89.96 57.96 102.49 >2 >2 >2 >2 >2 >2 >2 >2 >2 >2 >2 >2 >2 >2 >2 >2 5.7 2.7 2.1 6.5 8 2.6 3.6 4.3 5.8 1.75 0.17 2 2.28 0.38 2.41 3.62 2.9 3.1 0.98 1.44 0.89 1.31 0.37 2.82 2.33 h r² Favourable i allele j Reference 12.9 20.3 9.7 15.8 13.2 9.0 9.8 21.6 16.2 8.6 13.0 12.9 8.2 20.5 10.0 14.3 24.5-15.8 13.5 10.3 10.8 7.1 5.3 14.0 8.8 4.8 6.1 5.6 0.4 5.1 6.8 4.2 4.9 9 3.5 6.8 3 4 2.8 3.1 1.7 5 6.5 F2 F2 Io Io F2 F2 F2 Io F2 Io F2 F2 F2 F2 Io F2 Io F2 F2 F2 F2 F2 F2 F2 F2 F252 F2 F2 F2 F252 F252 F2 F2 P2 P1 P1 P2 P1 P2 P1 P2 P1 P2 P2 P2 P2 P2 P2 P1 Guingo et al., 1998 Guingo et al., 1998 Guingo et al., 1998 Guingo et al., 1998 Guingo et al., 1998 Guingo et al., 1998 Guingo et al., 1998 Guingo et al., 1998 Pelleschi et al., 2006 Pelleschi et al., 2006 Pelleschi et al., 2006 Pelleschi et al., 2006 Guingo et al., 1998 Guingo et al., 1998 Guingo et al., 1998 Guingo et al., 1998 Guingo et al., 1998 Guingo et al., 1998 Guingo et al., 1998 Bouchez et.al, 2002 Bouchez et.al, 2002 Bouchez et.al, 2002 Guingo et al., 1998 Bouchez et.al, 2002 Moreau et al.,2004 Moreau et al.,2004 Moreau et al.,2004 Moreau et al.,2004 Moreau et al.,2004 Moreau et al.,2004 Moreau et al.,2004 Moreau et al.,2004 Moreau et al.,2004 Ruta et al., 2010a Ruta et al., 2010a Ruta et al., 2010a Ruta et al., 2010a Ruta et al., 2010a Ruta et al., 2010a Ruta et al., 2010a Ruta et al., 2010a Ruta et al., 2010a Ruta et al., 2010b Ruta et al., 2010b Ruta et al., 2010b Ruta et al., 2010b Ruta et al., 2010b Ruta et al., 2010b Ruta et al., 2010b 56 57 a. Mapping population on which the traits were measured. b. Measured trait. c. The chromosome in 58 which the QTL is located. d. The bin(s) in which the cQTL is located. e. Position of the cQTL projected 59 on the map IBM2 Neighbors 2008. f. Confidence interval of the cQTL. g. Log of the odd (LOD) scores. 60 h. Percentage of the genetic variance explained by the QTL. i. Favourable allele for growth at each 61 QTL. For example, favourable allele for growth increased shoot dry weight. For silking, the presented 62 allele is the one that reduced the vegetative period. j. References 9 63 SI Table 6: Significance of co-location between QTLs of growth traits and QTLs of LERmax Mapping population 64 65 66 67 D D D D D D D E P P P P P P P P P P P P P P Trait a Final L of 4th leaf Final L of 6th leaf Internode 8 D Internode 8 L Root D at internode 7 Shoot DW Silking date Silking date Anthesis ASI Axile root L Ear DW Axile root ER Lateral root ER Final L of 6th leaf Lateral root L Leaf Area Plant height Root DW Shoot DW Silk DW Total root L % of co-location with QTLs of LERmax Threshold b Significant colocation 75% 100% 60% 0% 67% 100% 14% 11% 20% 40% 0% 40% 0% 0% 43% 0% 0% 0% 0% 50% 33% 0% 19% 24% 21% 16% 16% 12% 24% 25% 25% 25% 18% 22% 18% 8% 24% 14% 14% 25% 8% 14% 18% 14% * * * * * * * * * * a. Measured trait (L=length, ER=elongation rate, ASI=Anthesis-silking interval, D=diameter, DW=dry weight). b. Threshold above which percentage of co-location is considered as significant. 10 68 SI Table 7: List of genetic material included in the diversity panel Line A6 B73 BA90 CH10 CI1872U CLA17 CML245 CML247 CML254 CML287 CML312 CML333 CML339 CML340 CML341 CML344 CML360 CML389 CML389 CML440 CML444 CML69 CML91 CMLP1 CMLP2 CZL04006 CZL0617 CZL071 DTPWC9-F104 DTPWC9-F115 DTPWC9-F31 DTPYC9-F46 DTPYC9-F74 EA1174 EA1197 EA1201 EA1433 EA1712 EA1866 EP1 F2834T F39 F471 FC16 FC1852 69 70 Origin Tropical Temperate Dent Tropical Temperate Flint Tropical Tropical Tropical Tropical Tropical Tropical Tropical Tropical Tropical Tropical Tropical Tropical Tropical Tropical Tropical Tropical Tropical Tropical Tropical Tropical Tropical Tropical Tropical Tropical Tropical Tropical Tropical Tropical Tropical Temperate Flint Temperate Flint Temperate Flint Temperate Flint Temperate Flint Temperate Flint Temperate Flint Tropical Temperate Flint Temperate Flint Temperate Flint Temperate Dent Line FC209 FC24 FV-2 FV-252 FV-65 FV-7 FV-71 FV-75 FV-76 G37 G9 Gaspe H16 HP301 K64R KUI11 KUI3 KUI44 KY21 L256 LAN496 LP1037 LP1233 LP35 LPSC7-F103 LPSC7-F86 MBS847 MO17 MO22 N25 N6 NC298 NC304 NC320 NC338 ND30 NY302 PB40R SC55 SCMALAWI TZI18 W117U W85 YUBR05 ZN6 Origin Temperate Flint Temperate Flint Temperate Flint Temperate Dent Temperate Flint Temperate Flint Temperate Flint Temperate Flint Temperate Flint Tropical Tropical Temperate Flint Tropical popcorn Tropical Tropical Tropical Tropical Temperate Dent Temperate Flint Temperate Flint Temperate Flint Temperate Flint Temperate Flint Tropical Tropical Temperate Dent Temperate Dent Temperate Dent Temperate Dent Temperate Dent Sub-tropical Sub-tropical Sub-tropical Sub-tropical Temperate Dent Temperate Dent Temperate Dent Sub-tropical Sub-tropical Tropical Temperate Dent Temperate Dent Temperate Flint Sub-tropical
