Dead Zone Model_Inve..
advertisement
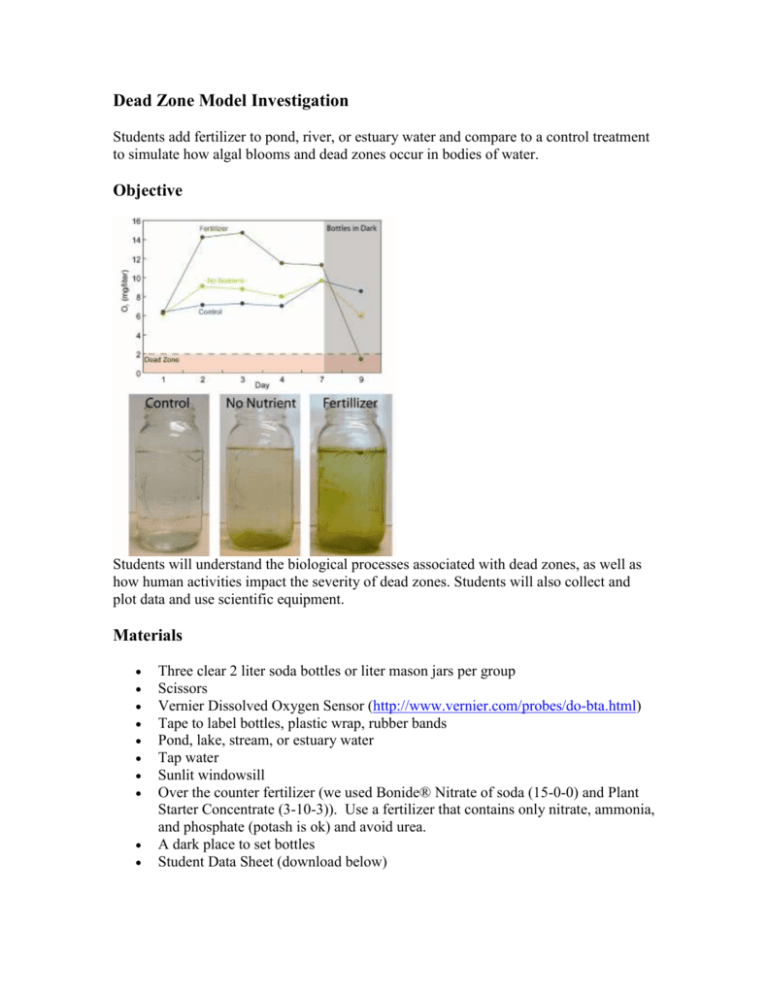
Dead Zone Model Investigation Students add fertilizer to pond, river, or estuary water and compare to a control treatment to simulate how algal blooms and dead zones occur in bodies of water. Objective Students will understand the biological processes associated with dead zones, as well as how human activities impact the severity of dead zones. Students will also collect and plot data and use scientific equipment. Materials Three clear 2 liter soda bottles or liter mason jars per group Scissors Vernier Dissolved Oxygen Sensor (http://www.vernier.com/probes/do-bta.html) Tape to label bottles, plastic wrap, rubber bands Pond, lake, stream, or estuary water Tap water Sunlit windowsill Over the counter fertilizer (we used Bonide® Nitrate of soda (15-0-0) and Plant Starter Concentrate (3-10-3)). Use a fertilizer that contains only nitrate, ammonia, and phosphate (potash is ok) and avoid urea. A dark place to set bottles Student Data Sheet (download below) Procedure Place students in groups of 3 or 4 and assign them to bring in three bottles or jars (per group) for the lab experiment; review the concepts of photosynthesis, respiration, and decomposition. 1. Cut the top off each bottle (if using 2-liter bottles) where the bottle tapers and remove plastic/paper covering. 2. Fill one bottle with tap water and let sit overnight. Label the bottle “control.” 3. Fill the other two bottles with pond, lake, etc. water. 4. Add 100 mg of each fertilizer to one of the remaining bottles and mix thoroughly to dissolve. Label this bottle “dead zone.” Label the remaining bottle “no nutrient.” Place each bottle in a sunlit window for 5-7 days. Have the students record daily observations of the bottles, including sight and smell descriptions as well as an oxygen reading using the Vernier lab probe. The best time of day to record oxygen is in the afternoon when the algae growing reach peak net photosynthesis (see manual for how to use Vernier lab probe – do not submerge the entire probe in water). The idea is to simulate an algal bloom, or eutrophication, in which excess phytoplankton grow in response to excess nutrient input. As the microscopic algae grow, you should observe increased oxygen levels due to increased photosynthesis. Eventually you will be able to physically see increased algae as the water turns green. You should observe significantly more algae growing in the fertilized bottle, and significantly higher oxygen levels. 5. Plot the dissolved oxygen reading each day using a spreadsheet or by hand as in Fig. 1a. 6. After 5-7 days (when an algal bloom has grown in the bottle), remove the dead zone bottle from the sunlight and cover with plastic wrap (if a 2-liter bottle) or the mason jar cap. Secure the plastic wrap with a rubber band and leave them in a dark place. This is meant to simulate what happens when phytoplankton in a coastal system die, sink to the bottom, and decompose, consuming oxygen. Have students continue to record data each day. Oxygen levels should fall to a dead zone (<2 milligram per liter) as algae die from lack of sunlight and start to decompose. Hints This experiment is suited from non-winter months, when sunlight, phytoplankton biomass, and temperature are at high levels. Reagent grade nitrate and phosphate can be purchased or obtained from a chemistry lab and used instead of fertilizer. Take oxygen readings at the same time each day, ideally in the afternoon as this is the peak of daily phytoplankton oxygen production. You may need to leave the bottles in the sun for a few more days if you do not observe a marked difference between bottles, especially if you experience several cloudy days during the experiment. Students may need to be carefully supervised when using the oxygen probe, especially younger students. Lesson Resources Student Data Sheet
