Math_112_Quiz_1_Spring_09
advertisement
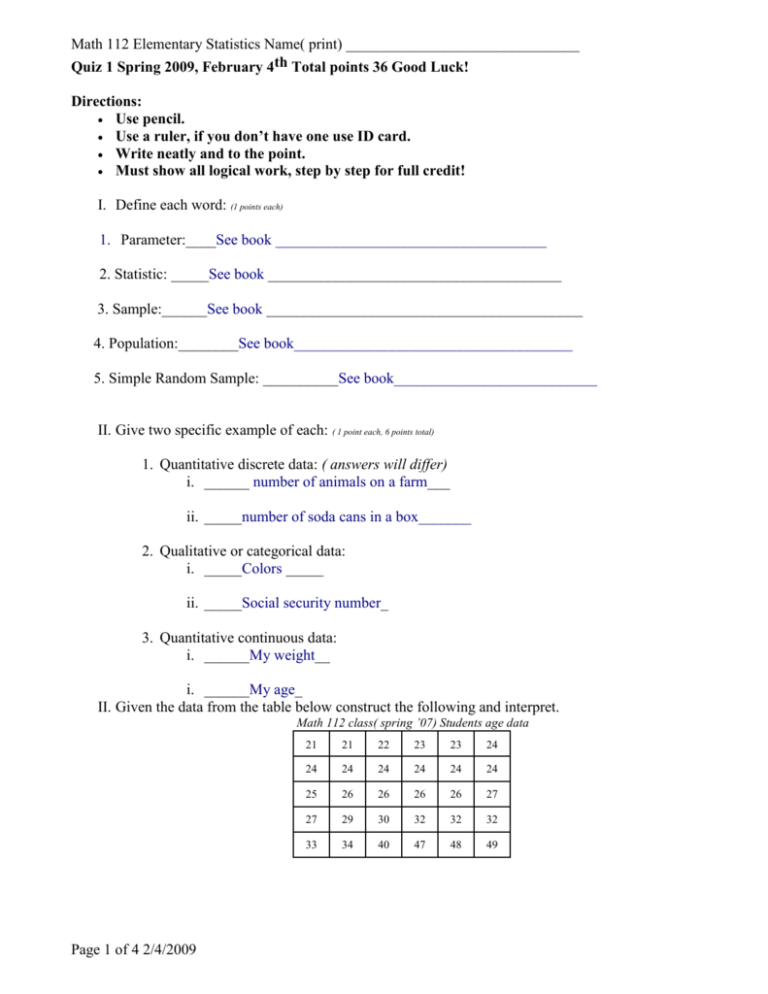
Math 112 Elementary Statistics Name( print) _______________________________ Quiz 1 Spring 2009, February 4th Total points 36 Good Luck! Directions: Use pencil. Use a ruler, if you don’t have one use ID card. Write neatly and to the point. Must show all logical work, step by step for full credit! I. Define each word: (1 points each) 1. Parameter:____See book ____________________________________ 2. Statistic: _____See book _______________________________________ 3. Sample:______See book __________________________________________ 4. Population:________See book_____________________________________ 5. Simple Random Sample: __________See book___________________________ II. Give two specific example of each: ( 1 point each, 6 points total) 1. Quantitative discrete data: ( answers will differ) i. ______ number of animals on a farm___ ii. _____number of soda cans in a box_______ 2. Qualitative or categorical data: i. _____Colors _____ ii. _____Social security number_ 3. Quantitative continuous data: i. ______My weight__ i. ______My age_ II. Given the data from the table below construct the following and interpret. Math 112 class( spring ’07) Students age data Page 1 of 4 2/4/2009 21 21 22 23 23 24 24 24 24 24 24 24 25 26 26 26 26 27 27 29 30 32 32 32 33 34 40 47 48 49 1. Fill in the table below using Student’s Age data from above: ( 1 point each column) Class Boundary Midpo int Frequency Relative Frequency ( rounded to 2 decimal places) Cumulative Relative Frequency (%) 21-25 20.5 23 15 42.86% 42.86% 26-30 25.5 28 10 28.57% 71.43% 31-35 30.5 33 6 17.14% 88.57% 36-40 35.5 38 1 2.86% 91.43% 41-45 40.5 43 0 0 91.43% 46-50 45.5 and 50.5 48 3 6.57% ~100 % Sum 35 2. Construct a neat Relative Frequency Histogram (on the vertical axis %) labeling horizontal and vertical axes, using the table above. ( 3 points) I did this in class!! Interpret (1 points each) : 3. ( skewed left or right or symmetric) ___Skewed right___________________ 4. Majority of ages are between what class? Between 21-25 or if you think of majority as more then half then majority is between 21-30 Page 1 of 4 2/4/2009 IV. Given the data from the table above (Age), identify and interpret the 5-number summary. ( 1 point each) 1. __Minimum Age is 21___ 2. _Q1=25%, Q1=24, This means 25% of ages are less then 24 or 75% of ages are greater then 24._ 3. _Q2=50%, Q3=26, This means 50% of ages are less then 26 or 50% of ages are greater then 26. 4. _Q3=75%, Q3=32, This means 75% of ages are less then 32 or 25% of ages are greater then 32. 5. __Maximum age is 49_ V. Find the z-score (round to two decimal places). Human body temperature has a mean of 98.2 F and a standard deviation of 0.62F. Convert the given temperatures to z-scores. ( 4 points total) i. 98.7F ii. 99.8F i. z 98.7 98.2 0.81 0.62 ii. z 99.8 98.2 2.58 0.62 Which of the above temperatures is usual or unusual and why? ii. is unusual because it is a z-value greater then 2 or you can say 99.8 is more then two standard deviation from the mean i.e. x 2s 98.2 2(0.62) 99.44 i. Is usual, z is within two sd. Page 1 of 4 2/4/2009 VI. Show all work step by step. Find the mean, mode, variance and standard deviation of the following sample data. ( 5 points) Heights (in) of men are: 71, 66, 72, 69, 68, 69 Mean: _ 71 66 72 69 68 69 69.1667 6 Mode:_____69___ Variance:__ s x 71 66 72 69 68 69 (x x) n 1 2 22.8334 4.5667 5 (x x)2 3.3610 10.0280 8.0276 0.0278 1.3612 0.0278 (x x) 2 22.8334 Standard Deviation:__ s 2 4.5667 2.137 _ Extra credit (0.5 points each, 3 points total) Give a specific example of the fallowing: 1. Nominal data____________________ 2. Ordinal data_____________________ 3. Interval data_____________________ 4. Ratio level data_________________ What measure of center is most sensitive to extreme values ________________ What is the range rule of thumb? ___________________ Page 1 of 4 2/4/2009
