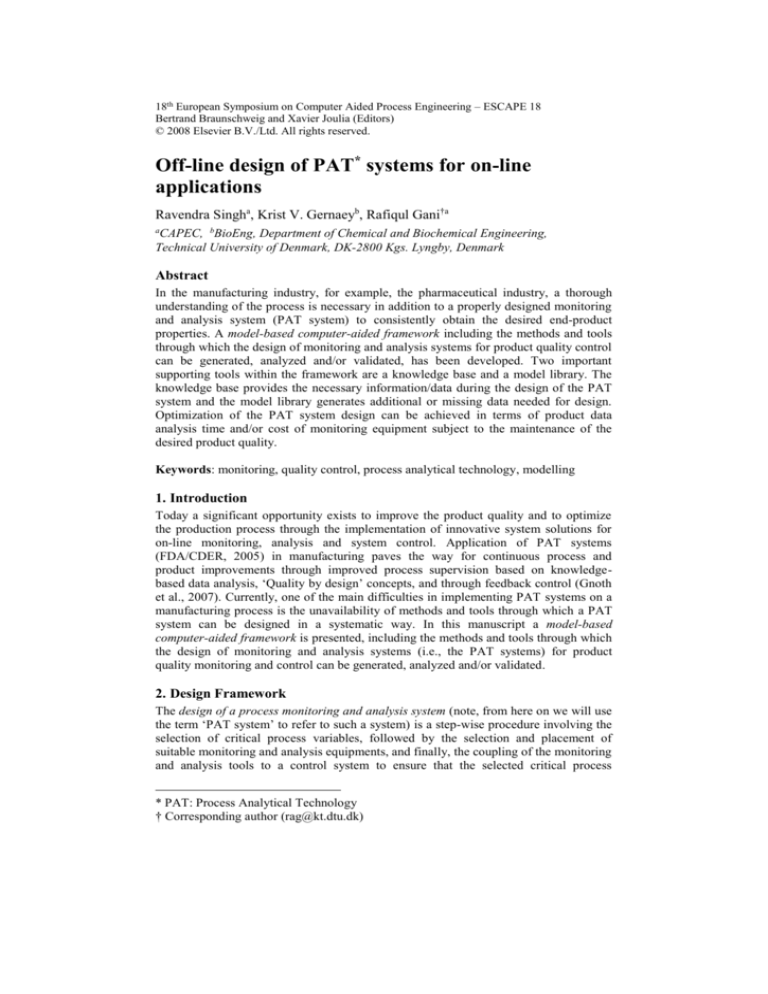
18th European Symposium on Computer Aided Process Engineering – ESCAPE 18
Bertrand Braunschweig and Xavier Joulia (Editors)
© 2008 Elsevier B.V./Ltd. All rights reserved.
Off-line design of PAT* systems for on-line
applications
Ravendra Singha, Krist V. Gernaeyb, Rafiqul Gani†a
a
CAPEC, bBioEng, Department of Chemical and Biochemical Engineering,
Technical University of Denmark, DK-2800 Kgs. Lyngby, Denmark
Abstract
In the manufacturing industry, for example, the pharmaceutical industry, a thorough
understanding of the process is necessary in addition to a properly designed monitoring
and analysis system (PAT system) to consistently obtain the desired end-product
properties. A model-based computer-aided framework including the methods and tools
through which the design of monitoring and analysis systems for product quality control
can be generated, analyzed and/or validated, has been developed. Two important
supporting tools within the framework are a knowledge base and a model library. The
knowledge base provides the necessary information/data during the design of the PAT
system and the model library generates additional or missing data needed for design.
Optimization of the PAT system design can be achieved in terms of product data
analysis time and/or cost of monitoring equipment subject to the maintenance of the
desired product quality.
Keywords: monitoring, quality control, process analytical technology, modelling
1. Introduction
Today a significant opportunity exists to improve the product quality and to optimize
the production process through the implementation of innovative system solutions for
on-line monitoring, analysis and system control. Application of PAT systems
(FDA/CDER, 2005) in manufacturing paves the way for continuous process and
product improvements through improved process supervision based on knowledgebased data analysis, ‘Quality by design’ concepts, and through feedback control (Gnoth
et al., 2007). Currently, one of the main difficulties in implementing PAT systems on a
manufacturing process is the unavailability of methods and tools through which a PAT
system can be designed in a systematic way. In this manuscript a model-based
computer-aided framework is presented, including the methods and tools through which
the design of monitoring and analysis systems (i.e., the PAT systems) for product
quality monitoring and control can be generated, analyzed and/or validated.
2. Design Framework
The design of a process monitoring and analysis system (note, from here on we will use
the term ‘PAT system’ to refer to such a system) is a step-wise procedure involving the
selection of critical process variables, followed by the selection and placement of
suitable monitoring and analysis equipments, and finally, the coupling of the monitoring
and analysis tools to a control system to ensure that the selected critical process
* PAT: Process Analytical Technology
† Corresponding author (rag@kt.dtu.dk)
2
Ravendra Singh et al.
variables can be controlled. As shown in fig. 1, the starting point for the design
methodology is the problem definition in terms of process specifications and product
quality specifications that can be provided either by the manufacturer or the PAT
system designer. A model library and a knowledge base have been developed, and act as
the supporting tools for the design of a PAT system. The ICAS-MoT modeling tool
(Sales-Cruz, 2006) is used for simulation of process operational models and the
systematic procedure proposed by Gani (Gani et al., 2006) is used for model analysis.
As shown in fig.1, the developed design algorithm relates the available product and
process specifications to the available supporting tools, and subsequently generates the
PAT system. If the obtained PAT system satisfies the requirements then it is selected as
the designed PAT system. The validation of the obtained PAT system is achieved by
comparing the simulated process performance with known process specifications. If the
process performance does not comply with the process specifications then the
corresponding design steps are repeated until a satisfactory design is obtained.
Model
library
ICAS-MoT
Process
specifications
Problem
definition
Design methodology
Design
Algorithm
Product quality
specifications
Knowledge
base
Proposed process
monitoring &
analysis system
(PAT system)
Acceptable
Validation
Final process
monitoring &
analysis system
(PAT system)
Predefined
product
quality
Not
Acceptable
Literature &
Industrial survey
Figure 1. Framework overview
2.1. Supporting Tools
2.1.1. Knowledge base
The knowledge base contains useful information needed for design of PAT systems. It
has been built through an extensive literature and industrial survey. It covers a wide
range of industrial processes such as fermentation, crystallization and tablet
manufacturing. It contains information for typical unit processes in terms of the type of
operation they perform, the process variables involved, the corresponding manipulating
variables (actuators), the equipments typically used for on-line measurement of data
(type of equipment, accuracy, precision, operating range, response time, resolution,
drift, cost etc.).
2.1.2. Model library
The model library contains a set of mathematical models for different types of unit
processes, sensors and controllers. Similar to the knowledge base, it covers a wide range
of industrial processes (fermentation, crystallization, tablet manufacturing). These
models support process analysis and help to generate additional or missing data needed
to obtain the design of a PAT system. For example, the models can be applied for the
prediction of process variables which are not measurable but required for the final
design. Simulations with the models can also be used for performing a sensitivity
analysis through which the effect of process variables on the final product properties
can be analyzed and critical process variables can be identified. The simulation models
Off-line design of PAT systems for on-line applications
3
also provide input for the interdependency analysis, through which the appropriate
actuators for each controlled variable can be selected.
2.2. Design methodology
The methodology used for the design of the PAT system is shown in fig. 2. It consists of
four main analysis steps which will be explained in more detail below.
Problem
definition
1. Product property
specifications
2. Process
specifications
Supporting Tools
Outcome
Knowledge base
3. Process analysis
Process points
Process variables
Model library
4. Sensitivity analysis
Critical process points
Critical process variables
Model library
5. Interdependency
analysis
Pairing of critical
variables & actuators
Knowledge base
6. Performance analysis
of monitoring tools
Selected monitoring
tools
7. Proposed process monitoring & analysis system
8. Validation
Not accepted
Accepted
9. Final process monitoring & analysis system
Figure 2. Design methodology
2.2.1. Process analysis
This step is concerned with the listing of the variables involved in the process, and the
listing of points of the process where monitoring might be required. This can be
achieved through a systematic process analysis by using the available product/process
specifications and by exploiting the knowledge base as supporting tool.
2.2.2. Sensitivity analysis
Here the critical process variables are identified from the selected list of process
variables. The model library or process data (if available) are used for this analysis. To
perform the sensitivity analysis, the process operational model is simulated through
ICAS-MoT. The effect of each process variable on the target product properties is
analyzed systematically through open loop simulation. The operational objectives have
to be assessed first. If an operational objective is not achieved, then the process
variables have to be analyzed. The variables which violate the operational limit and
have a major effect on the product quality are considered as the critical process
variables. For some of the variables which can not be modeled the sensitivity analysis
has to be performed qualitatively through inference from the knowledge base and/or by
the use of process data. All the critical process variables need to be monitored and
controlled. For some of the critical variables that can not be measured in real time, other
correlated properties have to be measured so that all critical variables can be measured
and controlled by using the correlations to the measurable variables.
2.2.3. Interdependency analysis
The interdependency analysis is performed to select the appropriate actuators for each
4
Ravendra Singh et al.
selected control variable. In this analysis the effect of process parameters on the
individual selected critical process variable is compared. A special feature (Sales-Cruz
and Gani, 2006) of ICAS-MoT can be used for this analysis. First, the response variable
and the sensitivity parameters are selected. Then these parameters are perturbed and the
effect of each parameter on the response variable is analyzed. The process parameter
which has the most significant effect on the considered critical process variable
(response variable) is selected as the actuator for that variable. At the moment only
SISO control is considered in the design methodology. The possibility to also select
more advanced multivariable control systems in the PAT system design will be included
in the future.
2.2.4. Performance analysis of monitoring tools
The performance analysis of the process monitoring tools is performed to select the
appropriate monitoring tools for each measurable critical process variable. The
measurement equipment for each measured critical process variable is selected from the
knowledge base, where one is able to list all the available sensors included in the
knowledge base for that variable. The performance of different types of measurement
equipment can be compared. The monitoring tool is then selected on the basis of one or
more of the following performance criteria: accuracy, precision and resolution, sensor
drift, response time and cost and operating range. The type of performance criterion
selected is application specific.
3. Case study: Fermentation process - Design of PAT system
The process flow sheet is adopted from the literature (Petrides et al., 1995) (see fig. 6).
3.1. Product property specifications
The desired product from the fermentation process is E. coli cells. At the end of the
fermentation process, the assumed E. coli cell concentration is 30 g/liter (dry cell
weight) in which the protein content is assumed to be 20% of the dry cell mass. The
composition (mass basis) of the outlet stream from the fermentor comprises 2.95%
biomass, 4.00% glucose, 0.58% salts, and 92.46% water.
3.2. Process specifications
The basic raw materials required include: starting culture (E. coli cells), nutrients
(glucose and salts), tryptophan, water, ammonia and air. The process equipment
includes: fermentor, mixing tank, continuous heat sterilizer, centrifugal compressor, air
filter and storage tank.
3.3. Process analysis
The process analysis provides the following list of process variables: temperature in the
fermentor, pH in fermentor, dissolved oxygen (DO) in the fermentor, dissolved CO 2 in
the fermentor, coolant flow rate, coolant temperature, ammonia flow rate, stirrer speed
in the fermentor, stirrer speed and stirring duration in the mixing tank, air flow rate to
the fermentor, heat sterilization temperature, steam flow rate in sterilizer, stirrer speed
in the mixing tank and stirring duration, cell growth rate, heat of reaction, substrate
concentration, biomass concentration in the fermentor, homogeneity in the fermentor,
homogeneity in the mixing tank
3.4. Sensitivity analysis
The operational objective for the fermentation step is to maximise the specific cell
growth rate. Open loop simulations (fig. 3) show that the value of the specific growth
rate is considerably lower than the maximum specific growth rate throughout the batch
Off-line design of PAT systems for on-line applications
5
fermentation. Analyzing the effect of process variables on the fermentation operation
shows that the pH violates the lower and upper limit of the optimal pH range in open
loop (see fig. 4), indicating thereby that it needs to be controlled throughout the
fermentation process. Repeating this procedure for all process variables yields the
following critical variables: temperature, pH, DO, dissolved CO2, homogeneity in the
fermentor and temperature in sterilizer and homogeneity in the mixing tank.
0.16
9
0.14
8
Specific growth rate
maximum specific growth rate
0.1
7
6
pH
mue (per hr)
0.12
0.08
5
4
0.06
Achieved profile (open loop)
Lower limit
Upper limit
3
0.04
2
0.02
1
0
0
0
2
4
6
8
10
12
14
16
18
0
t (hr)
2
4
6
8
10
12
14
16
18
t (hr)
Figure 3. Profile of operational objective
Figure 4. Critical process variable (pH)
DO(%change)
3.5. Interdependency analysis
Interdependency analysis is performed for each critical process variable to select the
actuator. For example, the dependency of the DO concentration (response variable) on
the air flow rate & stirrer speed (sensitivity parameters) is shown in fig 5. The air flow
rate is more sensitive compared to the
Interdependency analysis
12
stirrer speed and thus the air flow rate is
Air flowrate
selected as an actuator for DO control.
10
Stirrer speed
Repeating the procedure for all critical
8
control variables yields actuators as
More sensitive
6
follows: coolant flow rate for temperature,
Less
4
ammonia flow rate for pH, air flow rate
sensitive
for DO and dissolved CO2, stirrer speed
2
for homogeneity control in the fermentor,
0
-18 -15 -12 -9
-6
-3
0
3
6
9
12 15
18
steam flow rate for heat sterilization
Parameter (%change)
temperature control and stirring duration
Figure 5. Actuator selection for DO
for homogeneity in the mixing tank.
3.6. Performance analysis of monitoring tools
The performance of available monitoring tools (obtained from the knowledge base) for
each measured variable is compared and monitoring tools are selected as follows:
Thermocouple for temperature, electrochemical sensor for pH, optical sensor for DO
and dissolved CO2, and NIR for homogeneity.
3.7. Proposed process monitoring and analysis system
A feasible alternative of the process monitoring and analysis system is shown in fig. 6.
Within the fermentor, the DO concentration, pH, temperature and homogeneity need to
be monitored and controlled. Temperature in the heat sterilizer and homogeneity in
mixing tank also need monitoring and control. The aeration intensity used for DO
control also influenced the dissolved CO2 concentration so it is not needed to control
this variable explicitly. The critical process variables, corresponding monitoring tools
and actuators are shown in fig. 6. The response time of the selected monitoring tools is
6
Ravendra Singh et al.
also shown in the figure, which shows that the selected monitoring tools are robust
enough to allow for successful implementation of the control system.
Media
Stirring duration
Steam flow rate
c
c
Thermocouple
Homogeneity
R=0.5 s
[60]
Mixing
Air Filtration
R=0.1 s [107]
NIR
Water
NH3
CO2
air
Stirrer speed
c
Temperature
NIR
R=0.5 s [60]
Homogeneity
Heat
Sterilization
Thermocouple
R=0.1 s [107]
Ammonia
c
Electrochemical
sensor
Temperature
pH
c
Coolant flow rate
R<15 s [9]
Air
Fermentation
Centrifugal
Compression
Air
Filtration
Dissolved
oxygen
c
Optical sensor
Storage
T90=12 s [50]
Figure 6. Fermentation process flow sheet with designed PAT system.
c: controller, R: response time, T90: time for 90% response, NIR: near infrared,
[ ]: indicates the reference number in the knowledge base‡
4. Conclusions
A well-designed PAT system is essential to obtain the desired product quality
consistently. In this work we proposed a model-based computer aided framework
including the methods and tools for systematic design of PAT systems. The application
of the developed framework and methodology was demonstrated through a fermentation
process case study. The developed framework and methodology are generic: the
proposed systematic approach to the design of a PAT system is complimentary to
traditional process design, and should thus have a broad application range in chemical
and biological processes.
References
FDA/CDER, 2005, PAT, Process Analytical Technology (PAT) Initiative, U.S. Food and Drug
Administration,
Center
for
Drug
Evaluation
and
Research,
http://www.fda.gov/Cder/OPS/PAT.htm
Gani, R., Muro-Suñé, N., Sales-Cruz, M., Leibovici, C., & Connell, J. P. O. (2006). Fluid Phase
Equilibria, 250, 1-32.
Gnoth, S., Jenzsch, M., Simutis, R., & Lübbert, A. (2007). Journal of Biotechnology, 132 (2),
180-186.
Petrides, D., Sapidou, E., & Calandranis, J. (1995). Biotechnology and Bioengineering, 48 (5),
529-541.
Sales-Cruz, M. (2006). Development of a Computer Aided Modelling System for Bio and
Chemical Process and Product Design. PhD. Thesis, CAPEC, Department of Chemical
Engineering, Technical University of Denmark.
Sales-Cruz, M., & Gani, R. (2006). ChERD, 84 (A7), 583-594.
‡
[9]http://www.rmprocesscontrol.co.uk/Electrochemical-sensors/pHPLUS-Electrodes.htm
[50] http://www.in-situ.com/In-Situ/Products/TROLL9500/TROLL9500_RDO.html
[60] http://195.173.150.81/Process_16_2.pdf, [107] http://www.smartsensors.com/spectherm.pdf


