Question 3
advertisement
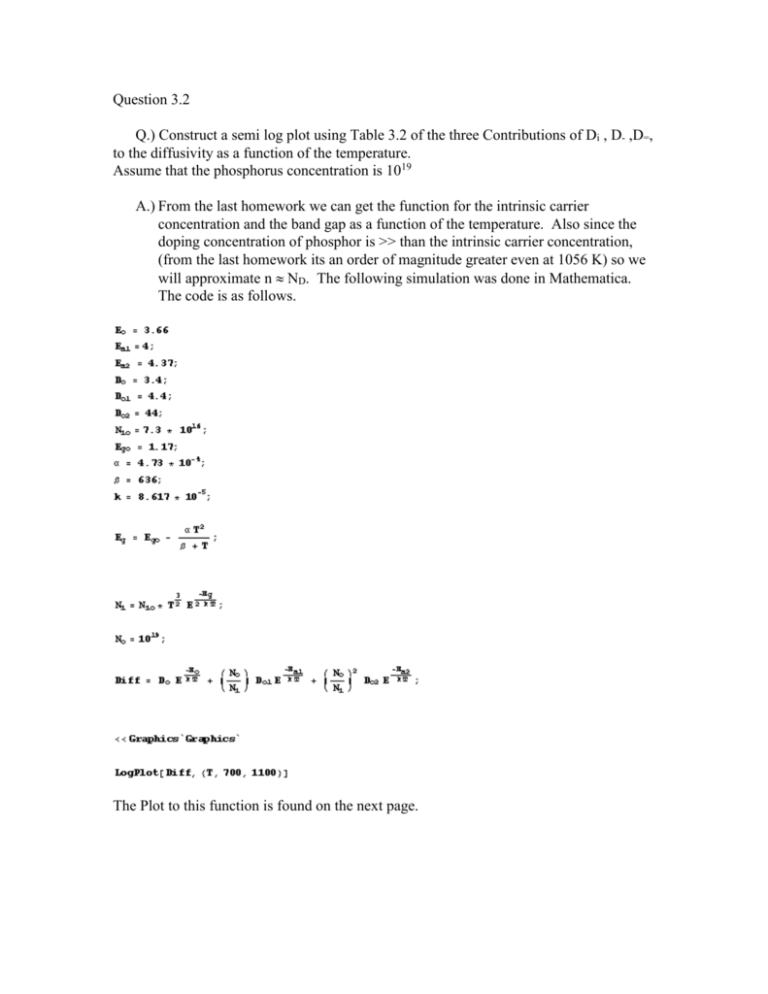
Question 3.2 Q.) Construct a semi log plot using Table 3.2 of the three Contributions of Di , D- ,D=, to the diffusivity as a function of the temperature. Assume that the phosphorus concentration is 1019 A.) From the last homework we can get the function for the intrinsic carrier concentration and the band gap as a function of the temperature. Also since the doping concentration of phosphor is >> than the intrinsic carrier concentration, (from the last homework its an order of magnitude greater even at 1056 K) so we will approximate n ND. The following simulation was done in Mathematica. The code is as follows. The Plot to this function is found on the next page. Question 3.3 Q.) One of the high concentration effects that was not discussed was that of stress. Arsenic, for example, is a much larger atom than silicon. When high concentrations of As are incorporated into the lattice it creates strain. Qualitatively discuss how this strain may effect the diffusivity? A.) When you have high concentrations of As in a Si lattice, near the solid-solubility. The stain is due to the fact that the As atom is larger than the Si atom. This causes the bonds of the Si lattice to be stretched out from their normal relaxed position. If the strain gets to big, or if the too many stress points too close to each other. Then the lattice will try and relax to a lower energy position by skipping a bond creating a vacancy, or by creating a stacking fault or some other kind of defect in the lattice which reduces the strain energy. Now As diffuses primarily though neutral or singly negative charged vacancies. So it would depend on the statistical interpretation of how many vacancies to stacking faults to interstials, etc. Although the more vacancies you generate the greater the diffusion rate will be. Question 3.6 Q.) A 10 minute 1100°C predeposition is done using arsenic. Assume that the surface concentration reaches the solid solubility limit. Next, the wafer is annealed for 24 hours at 1000°C. Use eq. 3.27 to predict the maximum carrier concentration. How does this compare to the solid solubility at 1000°C? Explain the distinction between the solid solubility and eq. 3.27. A.) Eq 3.27 3 C max 1.9 10 cm e 22 .453 kT Boatman’s constant k = 1.3806 x 10⁻²³ J/K = 8.617 x 10⁻⁵ eV/K 1000°C = 1273.15°K C max 1.9 x10 22 Exp[ .453 3.058 x10 20 cm 3 (8.617 x10 5 )(1273) Looking at page 14 of the text the graph shows that at 1000°C the solid solubility of As in silicon is approximately 1022 cm-3. So the maximum carrier concentration is 2 orders of magnitude less than the solid solubility of As. The difference between the solid solubility and eq 3.27 is that the As starts to form clusters of 4 As atoms bound together. This is not a precipitate since the As is still integrated into the Si diamond structure. The problem with this is that the cluster is not electrically active. That is, in this form the As does not donate an electron to the conduction band of the Si. So even though we have added As up to the very limit that the silicon can handle, not all of it is useable for electronic utilization. Eq 3.27 tells us what part of the doping will be able to use for the carrier concentration. Question 4.1 Q.) A 1000A gate oxide is required for some technology. It has been decided that the oxidation will be carried out at 1000°C, in dry oxygen. If there is no initial oxide, how long should the process be carried out for? Is the oxidation in the linear regime, parabolic regime, or in between? A.) We start off with no initial oxide layer so τ = 0 (Dip in HF for couple minutes) tox2 Atox B(t ) Bt or 1 2 A tox tox time B B Looking at the graphs on page 72 we get B(1000°C) 6 x 10⁻³ μm2/hr B/A(1000°C) 6 x 10⁻³ μm/hr So A 1 μm tox = 10-7m (tox)2 = 10-14m tox >> (tox)2 Since B B/A we can neglect (tox)2 and stay in the linear region which gives us A 500 hr 2 tox time (.1m) 16 hr B 3 m 3

