Verbs and nouns used to describe trends:
advertisement
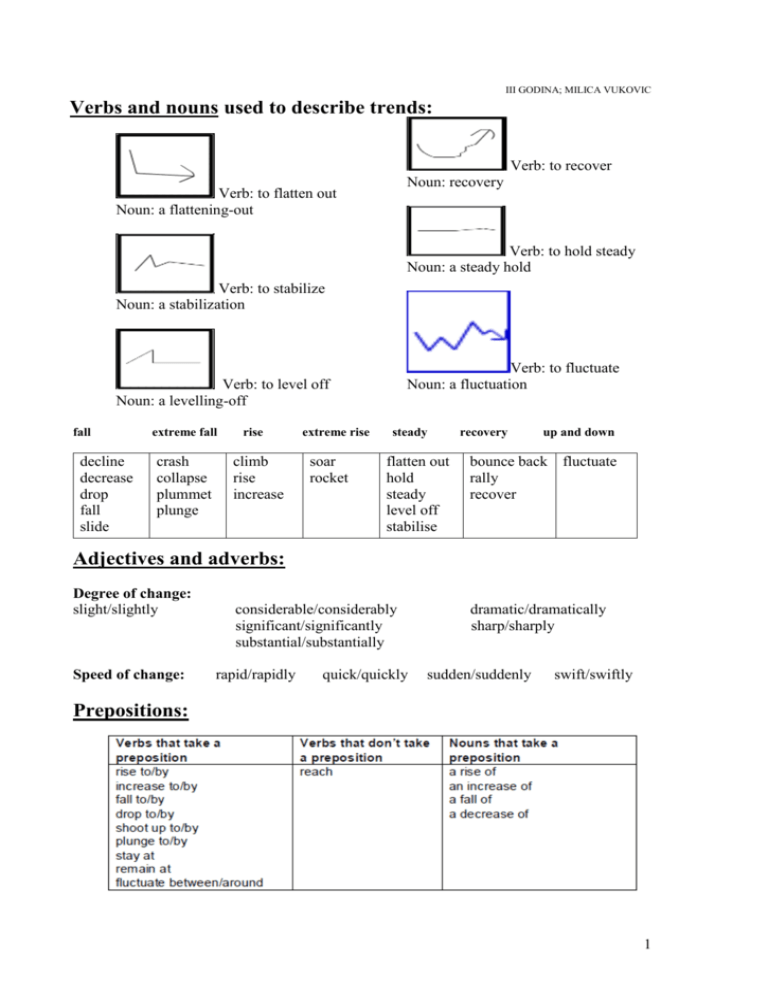
III GODINA; MILICA VUKOVIC Verbs and nouns used to describe trends: Verb: to recover Noun: recovery Verb: to flatten out Noun: a flattening-out Verb: to hold steady Noun: a steady hold Verb: to stabilize Noun: a stabilization Verb: to fluctuate Noun: a fluctuation Verb: to level off Noun: a levelling-off fall decline decrease drop fall slide extreme fall crash collapse plummet plunge rise climb rise increase extreme rise soar rocket steady flatten out hold steady level off stabilise recovery up and down bounce back fluctuate rally recover Adjectives and adverbs: Degree of change: slight/slightly Speed of change: considerable/considerably significant/significantly substantial/substantially rapid/rapidly quick/quickly dramatic/dramatically sharp/sharply sudden/suddenly swift/swiftly Prepositions: 1 I Describe the following trends: a) fluctuate b) plunge f) recover g) dip 1. 2. 6. 7. c) increase h) peak d) decline e) rocket i) stabilise 3. 4. 8. 5. 9. II Match the phrases and the trends: a) sales peaked b) prices crashed c) sales dipped d) prices levelled off e) sales bounced back f) prices climbed g) sales fluctuated h) inflation soared 1. 5. 2. 6. 3. 4. 7. 8. III Choose the most appropriate option to complete each statement: 1. Car production shows a slight decline. a dramatic increase. a slight increase. a dramatic decline. 2. Production 3. Costs of production reached a low and then fell down rapidly. slumped and then reached a peak. reached a peak and then fell rapidly. reached a peak rapidly and then fell. held steady and then rose substantially. rose substantially and then held steady. rose steadily and then stabilised. held substantially and then stabilised. 4. Coffee sales have increased dramatically. decreased slightly. increased slightly. decreased dramatically. 2 IV Write sentences to describe the chart: V Fill in the gaps with correct prepositions if necessary: The chart shows fluctuations in the price of crude oil over a thirty five year period, and clearly illustrates how oil prices are affected by world events. In general there has been an upward trend in the price of crude oil [1]…….. 1970, when it was only $1.30 per barrel. The oil embargo of the early 1970s, however, caused the price to rise sharply [2]…….. nearly $11 per barrel. The crisis ended soon afterwards, but the price remained [3]…….. around $11 to $13 per barrel until 1979. The Iranian revolution of that year had a huge impact on oil prices, which shot up [4]…….. $17 to reach [5]…….. about $30 per barrel in the same year. The following Iran-Iraq war caused a further increase, and the price reached [6]…….. a peak [7]…….. nearly $36 in 1980. From that point until 1985, the price fell steadily. However, from 1985 to 1986 the price suddenly plunged [8]…….. $13. For the next few years the price fluctuated [9]…….. $14, but with the invasion of Kuwait in 1990 there was a sudden rise [10]…….. $5. The price quickly fell again and remained stable for most of the 1990s. Things changed once again at the end of the decade, and from 1999 to 2000 the price increased [11]…….. almost $10 per barrel. Despite a slight drop in 2000, the rise continued and by the end of the period, the price of crude oil had shot up [12]…….. a peak of $50 per barrel. 3 4
