Solubility handout
advertisement
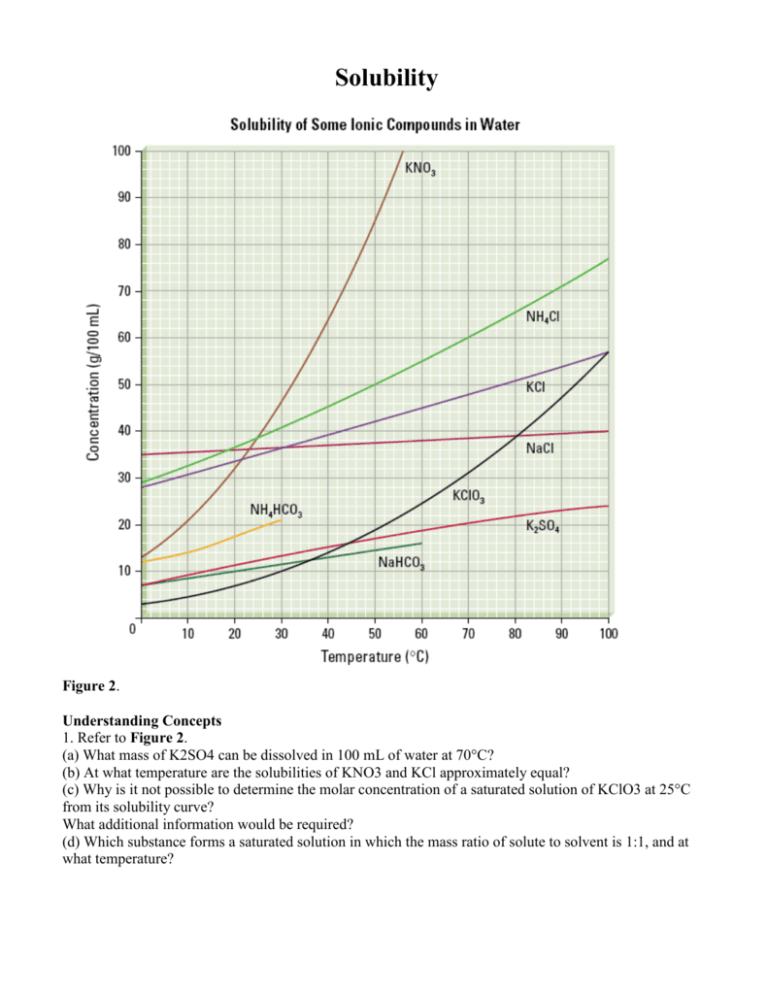
Solubility Figure 2. Understanding Concepts 1. Refer to Figure 2. (a) What mass of K2SO4 can be dissolved in 100 mL of water at 70°C? (b) At what temperature are the solubilities of KNO3 and KCl approximately equal? (c) Why is it not possible to determine the molar concentration of a saturated solution of KClO3 at 25°C from its solubility curve? What additional information would be required? (d) Which substance forms a saturated solution in which the mass ratio of solute to solvent is 1:1, and at what temperature? 2. A solution containing equal masses of NaCL and KCl is slowly cooled. (a) At what temperatures might sodium chloride precipitate first, without precipitating potassium chloride? (b) At what temperatures might potassium chloride precipitate first, without precipitating sodium chloride? 3. If you completed Investigation 7.1.1, you generated a solubility curve for KNO3(aq). Compare your curve to the curve in Figure 2. Are there differences? How would you account for any differences? 4. When you open a can of pop, which is more likely to fizz and spray: a can at room temperature or a cold can from the refrigerator? Explain why using your understanding of gas solubility. 5. (a) The solubility of oxygen in blood is much greater than its solubility in pure water. Suggest a reason for this observation. (b) If the solubility of the oxygen in blood were the same as in pure water, how would your life be different? 6. For any solute, what important condition must be stated in order to report the solubility? 7. Sketch a solubility graph showing two lines labelled “solids” and “gases.” Assume a straight-line relationship and show the generalization for the change in solubility of each type of substance with increasing temperature.
