Figures for Chapter 3
advertisement
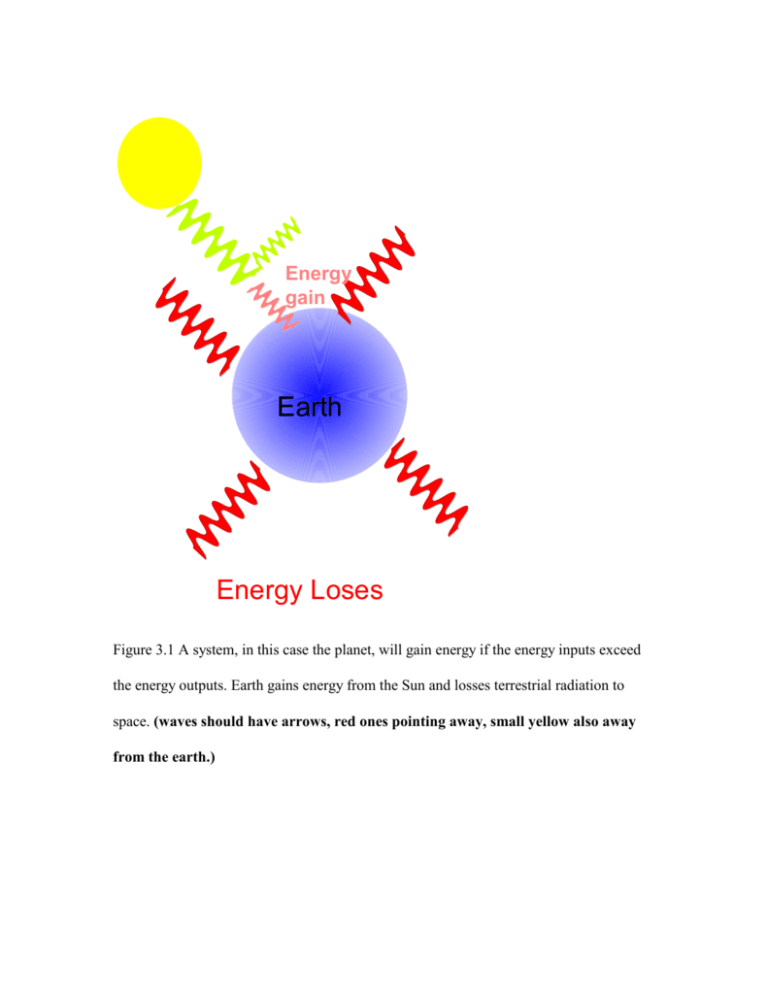
Energy gain Earth Energy Loses Figure 3.1 A system, in this case the planet, will gain energy if the energy inputs exceed the energy outputs. Earth gains energy from the Sun and losses terrestrial radiation to space. (waves should have arrows, red ones pointing away, small yellow also away from the earth.) Turbulent Eddies Figure 3.2 Changes in wind velocity with altitude near generate turbulence. These turbulent eddies produce fluctuating vertical motions that transfer heat from the surface to the atmosphere. Figure 3.3 Temperature cycles are characterized by a maximum, minimum, and range. 35 85 30 25 75 20 65 15 55 10 45 Miami, FL (26N, 80W, 7 f eet) New York, NY (41N, 74W, 13 f eet) 35 25 Jan Feb Mar Apr May Jun Jul Aug Sep Oct 5 0 Average Temperature (C) Average Temperature (F) Effect of latitude 95 Nov Dec Month Figure 3.4 Comparison of the seasonal temperature cycles observed at Miami, FL and New York, NY. (Include map inset of locations) 550 Incoming Solar Energy 500 450 400 350 300 250 Miami, FL (26N, 80W, 7 f eet) New York, NY (41N, 74W, 13 f eet) 200 150 100 Jan Feb Mar Apr May Jun Jul Aug Sep Oct Nov Dec Month Figure 3.5 The incoming solar energy at the top of the atmosphere over Miami, FL and New York, NY. The greater variation of incoming solar energy over New York explains the larger amplitude in temperature annual cycle (Figure 3.4). (Include map inset of locations) Monthly av eraged temperature of a desert region 110 35 90 30 80 25 70 20 In Salah, Algeria (27N, 2.5E, 919 f eet) 60 15 50 Average Temperature (C) Average Temperature (F) 40 100 10 Jan Feb Mar Apr May Jun Jul Aug Sep Oct Nov Dec Month Figure 3.6 Deserts, such as In Salah Algeria, have a large annual temperature range. Compare the annual cycle of In Salah with Miami, FL, which is nearly at the same latitude. (Include map inset of locations, and include Miami FL temperature cycle) Monthly average temperature (F) 80 25 70 20 60 15 50 10 40 5 30 0 -5 20 Mt. Washington, NH (44 16N, 71 18W, 5727 f t) Burlington, VE (44 28N, 73 09 W, 300 f t)) 10 0 Jan Feb Mar Apr May Jun Jul Aug Sep Oct Nov Dec -10 -15 Monthly Averaged Temperature (C) Altitude ef f ect Month Figure 3.7 A demonstration of the effect of altitude on the seasonal temperature cycle. (Include map inset of locations) Sun's rays South North Figure 3.8 In the Northern Hemisphere the sun’s rays are more intense on a south facing slope than one facing north. In the northern hemisphere solar panels face south to take advantage of the increased intensity of the sun’s rays at the surface of the panel. Figure 3.9 The trees are growing on the north facing slopes. Solar energy shining on the south facing slopes are less favorable for these trees due to the lack of available water. (Maybe add arrows as in figure 3.8 on south facing slope) Effect of near by bodies of water Average Temperature (F) 28.5 80 24.5 70 20.5 16.5 60 12.5 Dallas TX (33N, 97W, 481 feet, ) Los Angeles (34N, 118.5W, 97 feet) 50 8.5 40 Average Temperature (C) 32.5 90 4.5 Jan Feb Mar Apr May Jun Jul Aug Sep Oct Nov Dec Month Figure 3.10 A comparison of the seasonal temperature cycles of Dallas TX and Los Angeles CA. (Include map inset of locations) Effects of ocean current temperature 65 10 45 5 35 0 25 -5 15 -10 Holy Cross AL (62.2 N, 159.75W) Trondheim, Norway (63.4 N 10.5 E) 5 -15 Average Temperature (C) Average Temperature (F) 15 55 -20 -5 Jan Feb Mar Apr May Jun Jul Aug Sep Oct Nov Dec Month Figure 3.11 The winter warming in Trondheim Norway is due the Gulf Stream. (Include map inset of locations) Clouds reflect solar energy and thus reduce warming below cloud base Clouds emit longwave energy and thus increase warming below cloud base Figure 3.12 During the day clouds reflect solar radiation back to space and reduce energy gains of the air below and the surface. Clouds emit longwave radiation and inhibit cooling of the air below. (Draft) The effect of cloud cover 22 70 20 66 18 62 16 58 14 54 12 Los Angeles (34N, 118.5W, 97 f eet) San Fransico (37.7N, 122.5W, 48 f eet) 50 10 Average Temperture (C) Average Temperature (F) 74 8 46 Jan Feb Mar Apr May Jun Jul Aug Sep Oct Nov Dec Month Figure 3.13 Clouds reduce the annual temperature range of a city. (Include map inset of locations) Figure 3.14 Temperature departures from the global mean temperature over the last century. This is evidence that the average global temperature is increasing. Whether this is a natural trend or a result of human activity is under debate. Volcanic ash layer Figure 3.15 Volcanic ash reduces the amount of solar energy gains near the surface, causing a cooling. Figure 3.16 The diurnal variation in temperature is primarily controlled by energy gains from the sun and energy losses due to emission of infrared radiation. Temperature increases when the energy gains exceed the energy losses, and the temperature decreases when the net energy is negative. (See Ahrens's Essentials, figure 3.2 for an example). T e m p e ra tu rep ro file sn e a rth es u rfa c eth ro u g h o u tth ed a y 2 1 .6 1 .4 1 .2 Altitude(km) 1 8 :0 0p m .8 .6 .4 .2 0 1 0 3 :0 0p m 5 :0 0a m 1 0 :0 0a m 1 5 2 0 2 5 T e m p e ra tu re(C ) 3 0 3 5 T e m p e ra tu rein v e rs io n Figure 3.17 The diurnal temperature cycle extends only a short distance from the ground. (We can break this up into a sequence of four pictures - 3pm, 8 pm, 5 am and 10 am.) Figure 3.18 Photograph taken from the space shuttle of pollution over Mexico City. This pollution is often trapped by a temperature inversion. Figure 3.19 Cold air drains down the slope into the valley where pollution can get trapped near the ground due to a temperature inversion near the surface. Figure 4.20 The wind chill factor. Under windy conditions there are more molecules removing heat from your body.


