Figures for Chapter 14
advertisement
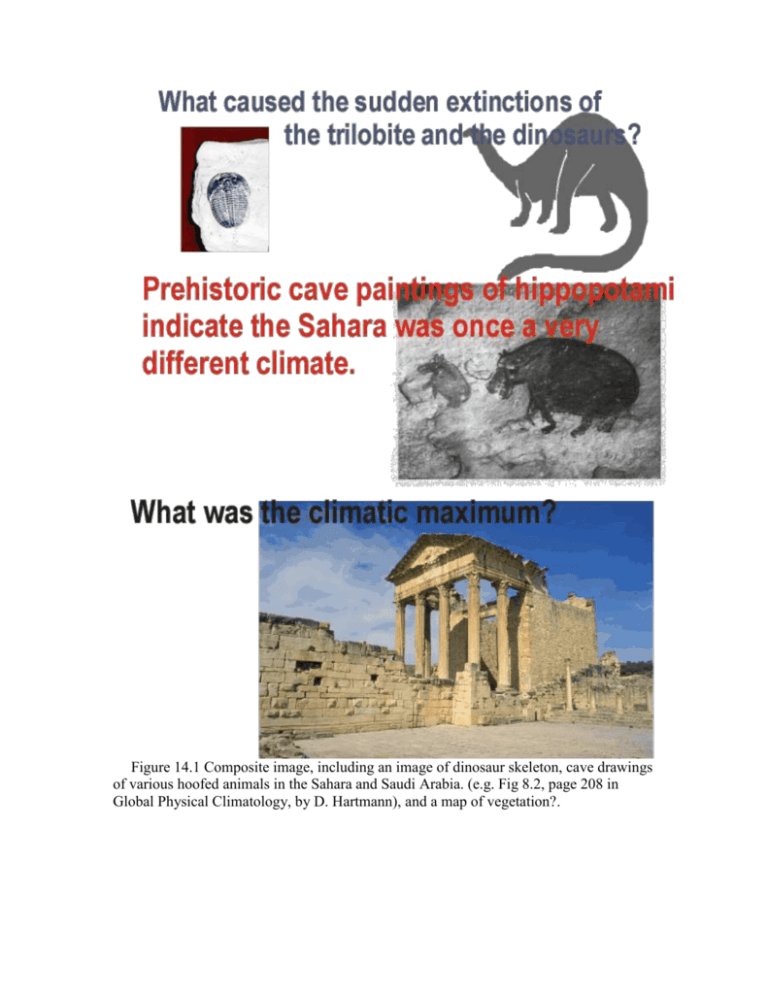
Figure 14.1 Composite image, including an image of dinosaur skeleton, cave drawings of various hoofed animals in the Sahara and Saudi Arabia. (e.g. Fig 8.2, page 208 in Global Physical Climatology, by D. Hartmann), and a map of vegetation?. Figure 14.2 A plot of the number of times the annual average temperature of Madison, WI fell within a given temperature interval. This type of figure is called a histogram, and provides a useful statistical description of the data. Listed are the mean of all the values, the minimum and maximum annual average temperature, and the standard deviation. 8 Precipitation (inches) 7 Portland, Oregon, (9.1 m 45.5N 124W) Montreal Canada (57m, 45.5N, 73.5W) 6 5 Total Precipitation: Portland 39.9 in Montreal, 40.8 in 4 3 2 1 0 Jan Feb Mar Apr May Jun Jul Aug Sep Oct Nov Dec Month Figure 14.3 Monthly average precipitation for Portland Oregon, USA and Montreal Canada. Figure 14.4 Image of different scales of climate (To Come) Figure 14.4 Snow fences are placed to stop the movement of snow drifts. The microclimate of the region is modified by depositing more snow in the downward direction of the snow fence then in the up-wind direction. The prevailing wind direction is from the left of the fence. (Maybe we can also show a line graph of wind blowing through a snow fence, losing speed and snow being deposited on the downwind side of the fence.) 80 Temperature (F) 70 Land Lake 60 50 40 30 20 Jan Feb Mar Apr May Jun Jul Aug Sep Oct Nov Dec Month Figure 14.5 The average land temperature versus the average surface lake temperature in the Southern Lake Michigan region. Figure 14.6 Vegetation modifies the air above. The temperature above the dunes on this bright day are higher than that of the surrounding vegetation. Figure 14.7 Concentration of atmospheric CO2 and CH4 determined from analysis of air bubble chemistry from an ice core cut from Vostk, Antarctica. Variations in these gases are well correlated with changes in temperature. (See figure 3, page 204 of the Encyclopedia of Climate and Weather -- from Lorius, C. et al "The Ice-core record: Climate sensitivity and future Greenhouse Warming", Nature 347, 1990, 139-145. Maybe turn this figure sideway and add another that represents depth into the ice core.). Figure 14.8 A dust storm emanating from the Sahara as seen from a satellite. These dust storms can carry Saharan soil as far as South America, North America, and even Greenland. Figure 14.9 Layers of soil deposited on the ocean floor provide evidence of geological change. (need a photograph). Figure 14.10 Variations in the isotope ratio of 18O to 16O measured from fossil shells over the last 800,000 years. Positive values indicate warmer periods. Periods as warm as today occur infrequently. Notice that approximately every 100 thousand years a warm period exists. Figure 14.11 Measuring and counting tree rings can provide clues into past climates. The graph shows a plot of annual precipitation in Iowa derived from analysis of treerings. Notice the dry periods in the decades around 1700, 1740, 1820, 1890 and 1930. (figure from Duvick and Blasing 1981, delete phrase 10-year running mean cm) Also need a photo of 'tree rings'.) . Figure 14.12 The above a map shows the continents as they appear today. In the past (see below), the continents fit together to form a larger landmass. The shapes of the continents fit together like a jigsaw puzzle. In addition to the jigsaw pieces locking together, the patterns on the surface must match. Similarly, patterns on the Earth's surface must match to prove that the continents were truly combined. The figure above demonstrates how the scars left by glaciers on the continents millions of years ago appear today and then. (See also page80, figure 4.1 of Earth Science Today by Murphy and Nance or see Ahrens Hard cover, page 512, Fig 19.7) Figure 14.13 The trilobite flourished during the Paleozoic era, with over 10,000 species, but they were extinct by the end of the era. The exact cause of a mass extinction during the end of the period is unknown, but the extinction is likely attributed to a shift in climate. Figure 14.14 A collision with a large meteor is believed to have caused a climate change that resulted in the extinction of 75% of the species at the end of the Mesozoic Era. The top map indicates the landmass and the point of contact at the time of the collision. The outlines of the Chixulub crater are seen today in gravity and magnetic field data of the region. (We want to combine these three images, the to is give the big picture, then zoom in, as the middle figure does and then show the crater impact zoom in.) Figure 14.15 Evidence of glaciers are found in the landscape. A) Moraines formed at the edge of glaciers, B) Large boulders which are transported by glaciers and C) scratch marks in bedrock reveal the movement of continental glaciers. (See photos in geology books, I think got this one from Earth Sciences, published by Wadsworth.) Figure 14.16, The extent of the ice sheets over North America during the Pleistocene. The arrows indicate the direction of advance of the glacier. Figure 14.17 The average temperature changes over the last 18,000 years. A detailed look of the period between 800-2000 AD is also shown. Figure 14.18 The change of sea level over the past 18 thousand years. Decreases in the amount of land ice over the last 18,000 years have caused the sea level height to increase approximately 120 meters. (Modify figure to translate numbers from left (top) to right (bottom) axes. ) Figure 14.19 The average height above sea level of the snow line in Norway during approximately the last 12,000 years. An increase in the height above sea level of the snow line indicates a warm period. The Climatic optimum, a warm period in human history, has a high snow line. Tropical (A) Polar (E) Severe Mid-latitude (D) Mild Mid-latitude (C) Dfc Dwc EF ET Dfb Dwb Dfa Dwa Cfa Cfw Dfd Dwd Af Am Aw Cfc Cfb Csb Csa Af Am Aw No dry season Short dry season Winter dry season BWh BSh BWk BSk Low latitude dry Low latitdue semi-dry Mid-latitude dry Mid-latitude semi-dry Csa Csb Cfa Cwa Cfb Cfc Dry, hot summer Dry, warm summer Hot summer, no dry season Hot summer, brief winter dry season Mild, no dry season, warm summer Mild, no dry season, cool summer Dfa Dfb Dfc Dfd Dwa Dwb Dwc Dwd Severe winter, no dry season, hot summer Severe winter, no dry season, warm summer Severe winter, no dry season, cool summer Extremely severe winter, no dry season, cool summer Severe winter, winter dry season, hot summer Severe winter, winter dry season, warm summer Severe winter, winter dry season, cool summer Extremely severe winter, winter dry season, cool summer Dry (B) BSk BWk BSh BWh Figure 14.20 Overview of the main climatic groups with respect to temperature and precipitation. In general, temperature increases from left to right and precipitation from bottom to top of the figure. (Add ET No Summer and EP Perennial ice.) ET EF No summer Perennial Ice Figure 14.21 A world map of the Koppen climate classification scheme. (for example, Figure 15-1, page 414, of new Aguado and Burt) 16 Iquitos, Peru (115 m), 3.65S, 73.3W Af Asuncion, Paraguay (139), 25S, 57.5W Aw Manaus, Brazil (44m) 3S 60W, Am Precipitation (inches) 14 12 10 8 6 4 2 0 Jan Feb Mar Apr May Jun Jul Aug Sep Oct Nov Dec Month 85 Iquitos, Peru (115 m), 3.65S, 73.3W Af Asuncion, Paraguay (139), 25S, 57.5W Aw Manaus, Brazil (44m) 3S 60W, Am Temperature (F) 80 75 70 65 60 Jan Feb Mar Apr May Jun Jul Aug Sep Oct Nov Dec Month Figure 14.22 Temperature and precipitation for three tropical climate regimes. The altitude, latitude and longitude of each station is given in the legend (Show location of these cities on a map, like most intro books now have. Also, label the curves Af, Aw and Am.) 90 85 Dakar Senegal (40 m) 14.5N 17.5E, BSh Cairo, Egypt (116 m) 30N 31.5E BWh Temperature (F) 80 75 70 65 60 55 50 Jan Feb Mar Apr May Jun Jul Aug Sep Oct Nov Dec Month 11 10 Dakar Senegal (40 m) 14.5N 17.5E, BSh Cairo, Egypt (116 m) 30N 31.5E BWh Precipitation (inches) 9 8 7 6 5 4 3 2 1 0 Jan Feb Mar Apr May Jun Jul Aug Sep Oct Nov Dec Month Figure 14.23 Example temperature and precipitation for BSh and BWh climates regimes. (Show location of these cities on a map. Label curves BSh, Bwh.) 90 San Diego, USA (4 m) 33N 117W, BSk Santa Cruz, Argentina, BWk Temperature (F) 80 70 60 50 40 30 Jan Feb Mar Apr May Jun Jul Aug Sep Oct Nov Dec Month 3 Precipitation (inches) 2.5 San Diego, USA (4 m) 33N 117W, BSk Santa Cruz, Argentina, BWk 2 1.5 1 0.5 0 Jan Feb Mar Apr May Jun Jul Aug Sep Oct Nov Dec Month Figure 14.24 Temperature and precipitation for dry, cold climates regimes of high latitude. December and January are summer months in the Southern Hemisphere. (Show location of these cities on a map. Label curves BSk and BWk.) Marine west coast 70 65 Bergen Norway (44m) 60.5N 5.5E Cfb Reykjavik, Iceland (28m) 64N 22W Cfc Temperature (F) 60 55 50 45 40 35 30 Jan Feb Mar Apr May Jun Jul Aug Sep Oct Nov Dec Month Marine west coast 10 9 Precipitation (inches) 8 7 6 5 4 3 2 Bergen Norway (44m) 60.5N 5.5E Cfb Reykjavik, Iceland (28m) 64N 22W Cfc 1 0 Jan Feb Mar Apr May Jun Jul Aug Sep Oct Nov Dec Month Figure 14.25 Marine west coast climates have mild temperatures throughout the year with no dry season. Cfb have warm summers and Cfc cool summers. This climate regime does not have to lie on the west coast of a continent, as the name would imply. (Show location of these cities on a map. Label curves Cfb and Cfc.) Humid Subtropical 90 New Orleans, LA USA (2.7m) 30N 90W, Cfa Hong Kong (33m) 22N 114E Cwa 85 Temperature (F) 80 75 70 65 60 55 50 Jan Feb Mar Apr May Jun Jul Aug Sep Oct Nov Dec Month Humid Subtropical 18 New Orleans, LA USA (2.7m) 30N 90W, Cfa Hong Kong (33m) 22N 114E Cwa Precipitation (inches) 16 14 12 10 8 6 4 2 0 Jan Feb Mar Apr May Jun Jul Aug Sep Oct Nov Dec Month Figure 14.26 Humid subtropical climates are hot and wet. The Cwa regime has a drier winter than summer while the Cfa is wet all year. (Show location of these cities on a map. Label curves Cfa and Cwa.) Mediterranean 80 75 Temperature (F) 70 65 60 55 50 45 Lisbon Portugal, (77m) 38.5N 9W Csa Santiago, Chile (520m) 33.5S 71W Csb 40 35 30 Jan Feb Mar Apr May Jun Jul Aug Sep Oct Nov Dec Month Mediterranean 5 Lisbon Portugal, (77m) 38.5N 9W Csa Santiago, Chile (520m) 33.5S 71W Csb 4.5 Precipitation (inches) 4 3.5 3 2.5 2 1.5 1 0.5 0 Jan Feb Mar Apr May Jun Jul Aug Sep Oct Nov Dec Month Figure 14.27 Mediterranean climates are have a distinct dry summer with a maximum precipitation in winter. June, July and August are winter months in Chile. (Show location of these cities on a map. Label curves Csa and Csb.) Humid Continental 70 Temperature (F) 60 50 40 30 20 Vladivostok, Russia (29m) 43N 132E Dwb Fargo, ND (273m) 47N 97W Dfb 10 0 Jan Feb Mar Apr May Jun Jul Aug Sep Oct Nov Dec Nov Dec Month Humid Continental 5 4.5 Precipitation (inches) 4 3.5 3 2.5 2 1.5 1 Vladivostok, Russia (29m) 43N 132E Dwb Fargo, ND (273m) 47N 97W Dfb 0.5 0 Jan Feb Mar Apr May Jun Jul Aug Sep Oct Month Figure 14.28 Climographs for Vladivostok, Russia (Dwb) and Fargo, North Dakota, USA (Dfb). (Include map and combine temperature and precipitation in one figure) (Show location of these cities on a map. Label cures Dwb and Dfb) Subarctic 60 Temperature (F) 40 20 0 -20 Fairbanks, AK (133m) 65N 148W Dfc Verkhoyansk, Siberia (100m) 67.5N 134E Dfd -40 -60 Jan Feb Mar Apr May Jun Jul Aug Sep Oct Nov Dec Month Subarctic 3 Fairbanks, AK (133m) 65N 148W Dfc Verkhoyansk, Siberia (100m) 67.5N 134E Dfd Precipitation (inches) 2.5 2 1.5 1 0.5 0 Jan Feb Mar Apr May Jun Jul Aug Sep Oct Nov Dec Month Figure 14.29 Fairbanks, Alaska, USA (Dfc) and Verkhoyansk, Siberia (Dfd) are examples of subarctic climates. Both cities have a very large annual range in temperature and small amounts of precipitation. (Show location of these cities on a map and label curves.) Polar 40 30 Temperature (F) 20 Barrow AK, (9.4m) 71N 157w ET Eismitte, Greenland, (9941ft) 71N 40W EF 10 0 -10 -20 -30 -40 -50 Jan Feb Mar Apr May Jun Jul Aug Sep Oct Nov Dec Month Polar Precipitation (inches) 1 Barrow AK, (9.4m) 71N 157w ET Eismitte, Greenland, (9941ft) 71N 40W EF 0.8 0.6 0.4 0.2 0 Jan Feb Mar Apr May Jun Jul Aug Sep Oct Nov Dec Month Figure 14.30 Polar climates have long, cold winters and are typically poleward of 70.(Show location of these cities on a map. Label curves ET and EF)
