Introduction: For quite a while, geologists have wanted a reliable
advertisement
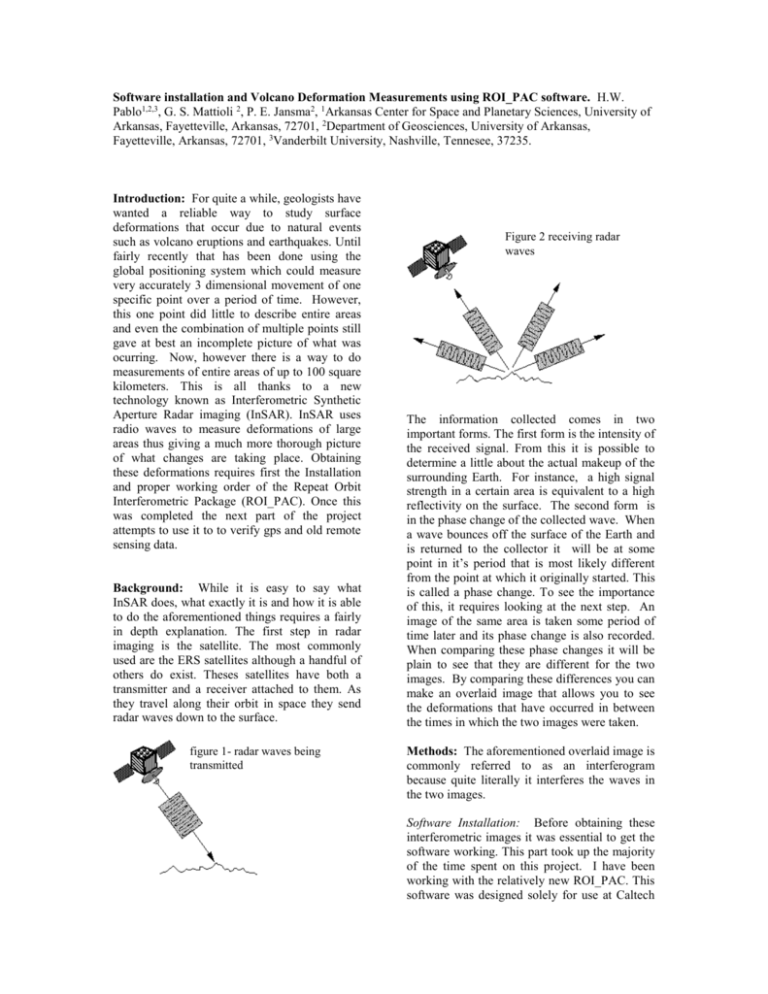
Software installation and Volcano Deformation Measurements using ROI_PAC software. H.W. Pablo1,2,3, G. S. Mattioli 2, P. E. Jansma2, 1Arkansas Center for Space and Planetary Sciences, University of Arkansas, Fayetteville, Arkansas, 72701, 2Department of Geosciences, University of Arkansas, Fayetteville, Arkansas, 72701, 3Vanderbilt University, Nashville, Tennesee, 37235. Introduction: For quite a while, geologists have wanted a reliable way to study surface deformations that occur due to natural events such as volcano eruptions and earthquakes. Until fairly recently that has been done using the global positioning system which could measure very accurately 3 dimensional movement of one specific point over a period of time. However, this one point did little to describe entire areas and even the combination of multiple points still gave at best an incomplete picture of what was ocurring. Now, however there is a way to do measurements of entire areas of up to 100 square kilometers. This is all thanks to a new technology known as Interferometric Synthetic Aperture Radar imaging (InSAR). InSAR uses radio waves to measure deformations of large areas thus giving a much more thorough picture of what changes are taking place. Obtaining these deformations requires first the Installation and proper working order of the Repeat Orbit Interferometric Package (ROI_PAC). Once this was completed the next part of the project attempts to use it to to verify gps and old remote sensing data. Background: While it is easy to say what InSAR does, what exactly it is and how it is able to do the aforementioned things requires a fairly in depth explanation. The first step in radar imaging is the satellite. The most commonly used are the ERS satellites although a handful of others do exist. Theses satellites have both a transmitter and a receiver attached to them. As they travel along their orbit in space they send radar waves down to the surface. figure 1- radar waves being transmitted Figure 2 receiving radar waves The information collected comes in two important forms. The first form is the intensity of the received signal. From this it is possible to determine a little about the actual makeup of the surrounding Earth. For instance, a high signal strength in a certain area is equivalent to a high reflectivity on the surface. The second form is in the phase change of the collected wave. When a wave bounces off the surface of the Earth and is returned to the collector it will be at some point in it’s period that is most likely different from the point at which it originally started. This is called a phase change. To see the importance of this, it requires looking at the next step. An image of the same area is taken some period of time later and its phase change is also recorded. When comparing these phase changes it will be plain to see that they are different for the two images. By comparing these differences you can make an overlaid image that allows you to see the deformations that have occurred in between the times in which the two images were taken. Methods: The aforementioned overlaid image is commonly referred to as an interferogram because quite literally it interferes the waves in the two images. Software Installation: Before obtaining these interferometric images it was essential to get the software working. This part took up the majority of the time spent on this project. I have been working with the relatively new ROI_PAC. This software was designed solely for use at Caltech and was received from open channel software. It was not designed to run specifically on Red Hat Linux 9 so it required lots of error testing. The first step was compiling the program in which certain pieces of code had to be changed so it would be read correctly. Once it was compiled and installed, I and Dr. Johnston from CAST would run the essential scripts and every time an error would come up we would go through the code determine what was causing the error and then attempt to fix it. Interferogram Creation: To use this software, the first thing you must obtain is two radar images of the same scene taken at two different times. For this data to be usable, the difference in the positions of the satellite while obtaining these two images must be less than 1 kilometer. They are first conditioned separately by ROI_PAC by computing the doppler shift and the size. Next the images are combined using orbital data most commonly obtained from the Delft Institute for Space-Oriented Space Research. This allows the program to overlay the two images as if they were being taken from precisely the same spot. Next one must acquire a digital elevation model (dem) of the scene. It takes this model and compares it with the actual scene to eliminate known deformations. The results of this process are three images: a phase image, an amplitude image, and an interferogram. Figure 4- Phase image of Southern California opened using the ENVI software package The results can be viewed in picture form using ENVI or a program called Digital Graphics X (DGX). There is no sample interferogram shown because it will not show up in black and white. Results: After several weeks the software was installed and the test data ran perfectly giving me my first piece of data. When attempting to verify results received from the island of Nevis it is as yet inconclusive. The first piece of real data has made it through data conditioning and is on the verge of showing results. The only problem is that it lacks a dem file given in the proper format to be read in ROI_PAC. One of the main issues is that the software was designed so specifically, that it only works with a narrow range of data types. Recreating these data types without a manual or much online help has proved difficult but progresses slowly. Acknowledgements: Thanks to Bill Johnston whose help in installing and error shooting the software was essential. Thanks to Henry Turner for his help throughout the summer. Thanks also to NASA for funding this program. Figure 1- Amplitude image of Southern California opened using the ENVI software package. References: 1. Delft Institute for Space Oriented Space Research http://www.deos.tudelft.nl/ 2. California Institute of Technology www.caltech.edu 3. Landserf www.Landserf.org 4. Open Channel Foundation http://www.openchannelfoundation.com


