Seed Production Diversity
advertisement
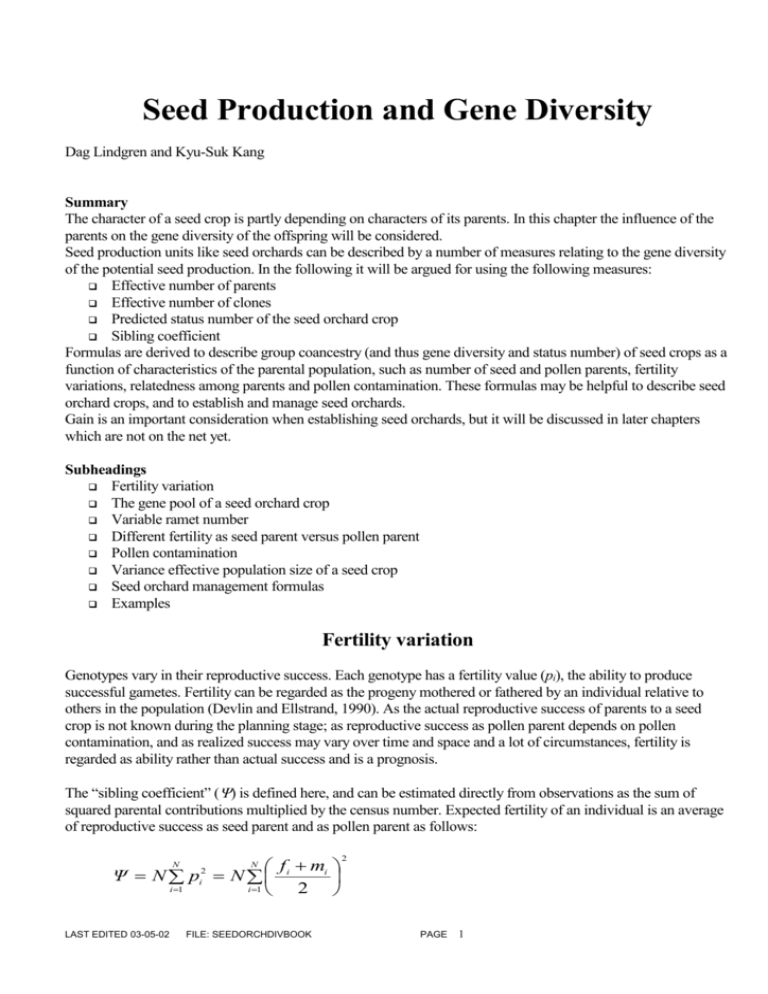
Seed Production and Gene Diversity Dag Lindgren and Kyu-Suk Kang Summary The character of a seed crop is partly depending on characters of its parents. In this chapter the influence of the parents on the gene diversity of the offspring will be considered. Seed production units like seed orchards can be described by a number of measures relating to the gene diversity of the potential seed production. In the following it will be argued for using the following measures: Effective number of parents Effective number of clones Predicted status number of the seed orchard crop Sibling coefficient Formulas are derived to describe group coancestry (and thus gene diversity and status number) of seed crops as a function of characteristics of the parental population, such as number of seed and pollen parents, fertility variations, relatedness among parents and pollen contamination. These formulas may be helpful to describe seed orchard crops, and to establish and manage seed orchards. Gain is an important consideration when establishing seed orchards, but it will be discussed in later chapters which are not on the net yet. Subheadings Fertility variation The gene pool of a seed orchard crop Variable ramet number Different fertility as seed parent versus pollen parent Pollen contamination Variance effective population size of a seed crop Seed orchard management formulas Examples Fertility variation Genotypes vary in their reproductive success. Each genotype has a fertility value (pi), the ability to produce successful gametes. Fertility can be regarded as the progeny mothered or fathered by an individual relative to others in the population (Devlin and Ellstrand, 1990). As the actual reproductive success of parents to a seed crop is not known during the planning stage; as reproductive success as pollen parent depends on pollen contamination, and as realized success may vary over time and space and a lot of circumstances, fertility is regarded as ability rather than actual success and is a prognosis. The “sibling coefficient” () is defined here, and can be estimated directly from observations as the sum of squared parental contributions multiplied by the census number. Expected fertility of an individual is an average of reproductive success as seed parent and as pollen parent as follows: f mi Ψ N p N i i 1 i 1 2 N LAST EDITED 03-05-02 2 i N FILE: SEEDORCHDIVBOOK 2 PAGE 1 where N is the census number, fi is the fertility as seed parent and mi is the fertility as pollen parent of a genotype i. Note that pi2 is the probability that two genes in the offspring come from the same parent i, summed over all parents, i.e., the likelihood that two gametes in the gamete pool originate from the same individual. The sibling coefficient expresses how fertility varies among parents as the increase in the probability that sibs occur compared to the situation where parents have equal fertility. The sibling coefficient cannot be smaller than one. If = 1, all individuals have the same fertility. If = 2, for instance, the probability that two individuals share a parent is twice as high, compared to when the parental fertility is equal across the population. The effective number of parents (Np) is defined as a function of fertility variation (), as NP N / . Fertility differences among population members can also be described by coefficient of variation (CV) in fertility. Sibling coefficient and coefficient of variation are equivalent concepts (provided pi estimates exist for all genotypes) and the relationship is as follows Ψ CV 2 1 . The sibling coefficient carries the same information as the coefficient of variation, but is based on a probabilistic aspect, while CV is based on a variance aspect. Also, refers to the orchard crop or offspring, while CV refers to the parental population. Therefore, may have the potential to give genetic information for describing gene diversity of orchard crops that is closer to the seed crop than is the CV. The sibling coefficient may be expressed separately for seed parents (f) and pollen parents (m) as N N i 1 i 1 2 f N f i 2 and m N mi . A function describing variations in fertility variation A probability density function can be helpful for describing features connected to fertility. Fertility variations can be described by a function f(x), where x is the percentile of trees ranked for fertility and f ( x ) dx 1 For a assumed large population of trees or a theoretical distribution, p f ( x) / N is the predicted fertility of the parent with a fertility rank corresponding to x. An example of an accumulated density function is the power x function, F ( x) f ( y )dy x a ; a 1 . The derivative of the power function is f ( x) ax a 1 . This function is one of the most basic and natural and is rather easy to deal with and in reasonable fit to observations (Bila 2000, Kang et al 2003 and cited literature). For a given population, an individual fertility (pi) can also be estimated in a relative sense, based on the sum of observations. Parents are then ranked for the fertility and transformed to cumulative contributions summing up to one. Cumulative contributions are plotted against the parents’ ranked proportions. The exponent of the fitted power function, a can also be expressed as a function of . The sibling coefficient is related to the exponent a as 1 a Ψ 1 1 . Ψ LAST EDITED 03-05-02 FILE: SEEDORCHDIVBOOK PAGE 2 The gene pool of a seed orchard crop Lindgren and Mullin (1998) developed formulas for the group coancestry of seed orchard crops, which will be used in the following. Consider the gene pool of a seed orchard crop. The gene pool is large as there are many seeds in a seed crop, so there is no genetic drift. The probability that the first gene originates from genotype i in the seed orchard is pi, and the probability that the second originates from genotype j is pj. The probability that these two genes originating from the orchard genotypes i and j are identical by descent (IBD) is θij . Thus the coancestry (or "coefficient of kinship"; "coefficient of relationship" is a similar measure which can be computed) between genotype i and j. The probability that any pair of genes is IBD can be found by adding over all possible pairs of genes from N contributors N N pi p j ij . i 1 j 1 The group coancestry of a seed orchard crop can be divided in two terms, one for self-coancestry and one for cross-coancestry, N N N p 2 (1 Fi ) N N pi p j ij i pi p j ij . 2 i 1 j 1 i 1 i 1 j i The first term considers only self-coancestry and the second coancestry between different seed orchard genotypes. Let’s consider the status number of a seed orchard crop in a simple case. If the seed orchard genotypes are unrelated the second term is zero, if there is no inbreeding, the first term becomes simple. For no relatedness and no inbreeding, status number becomes N N S N P 1 / pi2 . i 1 Note that this is the same expression as earlier achieved for NP, the effective number of parents (or clones) in a seed orchard. Similar expressions has been used many times before, it has similarities to the concept of effective population size as defined by Robertson (1961). 50 45 Status number Example: Related clones in seed orchard Relatedness of the clones has a strong effect on the status number. This is illustrated to the right. Status number in a seed orchard with 50 related, but non inbred clones. The coancestry is equal for all pair of clones =0.01, the clones contribute equally to the offspring and there is no inbreeding and no pollen contamination. Even extremely weak relationships have a considerable impact. 40 35 30 25 20 15 10 5 0 0.001 0.01 0.1 Coancestry between clones LAST EDITED 03-05-02 FILE: SEEDORCHDIVBOOK PAGE 3 1 Variable ramet number If N clones are represented by ri ramets with equal fertility, the fertility of a clone becomes proportional to the number of ramets and the group coancestry (average of all coancestry values) among ramets will be: N N r r i 1 j 1 i j N ri i 1 2 ij . If clones are unrelated and non-inbred, then r r 2 N S N P NC i 2 i r 1 where pi N i 2 pi r j 1 , which can be seen as a way of expressing that j the fertility is proportional to ri , the number of ramets. Different fertility as seed parent versus pollen parent Genotypes can have different reproductive success as seed parents compared to as pollen parents, and we can adapt the calculation of group coancestry and status number accordingly. Let us call the reproductive success of genotype i as pollen parent and seed parent mi and fj , respectively. The fertility can be viewed as the sum of these two fertilities, pi = mi + fi. Group coancestry can then be expressed as a sum of three terms, if the fertility is evaluated in its gender components: (mi f i )( m j f j ) ij mi m j ij f i f j ij 2 mi f j ij . i j i j i j i j The first term expresses the relatedness among pollen parent offspring, the second term the relatedness among seed parent offspring and the last term relatedness between offspring from seed parents and pollen parents. Let us consider the gene pool of the offspring of a population with different genders. Then, there are individual number series for seed parents and pollen parents. We know that the sum of all successes on either gender is 0.5, they add up to 1 together and each gender must have the same success. The population consists of Nm pollen parents and Nf seed parents. The individuals of the same sex contribute by equal amounts to the gene pool, thus mi=0.5/Nm and fi=0.5/Nf. The group coancestry of the population can be expressed in three terms, representing three possible interactions between genders, analogous to the formula above, as Nf Nf Nm Nm ij i 1 j 1 2 m 4N ij i 1 j 1 2 f 4N Nm N f i 1 j 1 ij 2Nm N f If there are separate sexes and no relatedness or inbreeding, group coancestry and status number can be formulated as follows. It is just to set θii =0.5; else θij=0. LAST EDITED 03-05-02 FILE: SEEDORCHDIVBOOK PAGE 4 1 1 0.125 N m Nf 4N m N f NS NP Nm N f Nm N f 8N N m f This expression has some similarity to the case with different sexes for the effective population size in the inbreeding sense. Example: Selective harvest Selective harvesting in seed orchard with 100 clones 100 90 80 Status number A seed orchard with 100 non-related, not inbred clones, each having equal reproductive success, is studied in the Figure to the right. One management action is to harvest seeds only from the best clones. The fewer clones harvested, the lower, of course, is the status number. However, the relationship is not linear; if seeds are harvested from rather few clones, the others who function as pollen parents (assuming here that there is no pollen contamination) have a considerable impact on status number. 70 60 50 40 30 20 10 0 0 20 40 60 Clones harvested 80 100 from Lindgren and Mullin 1998 Pollen contamination The formulas involving pollen contamination are mostly from Lindgren and Mullin (1998) and Kang, Lindgren and Mullin (2001), although the formal presentation is somewhat different. Some formulas developed by Lindgren and Mullin (1998) has constrained application for seed orchards exposed to pollen contamination as pointed out by Ruotsalainen et al. (2000). This is considered in the following, and motivates a somewhat more extended derivations. The fertilising pollen to seed orchard seeds often originates outside the orchard. E.g. a literature review by Kang (2001) compiling results from 25 studies, indicates that about 40% of the fertilising pollen for commercially important conifers origin from natural trees outside the seed orchard. This alien pollen has many disadvantages: It reduces gain; makes the seed orchard crops less predictable; reduces the possibility to use early crops; and may threaten the adaptation of the crop. But the contamination may also widen the gene diversity, increase the effective population size and reduce the inbreeding LAST EDITED 03-05-02 FILE: SEEDORCHDIVBOOK PAGE 5 Pollen contamination is a gene migration on the pollen parent side into the seed orchard crop from genotypes, which are not in the seed orchard. It is measured as the fraction of the genes in the seed orchard crop with migrated into the seed orchard and is designated by M. The pollen contamination rate will be 2M, as there is no migration on the seed parent side, the gene migration will be half of the pollen contamination rate. These migrated genes have to be considered when evaluating the group coancestry for the seed orchard crop. The coancestry between the genes of two contaminating pollen gametes is θMM; this is the probability that two migrating pollen grains have genes, which are identical by descent. The coancestry between seed orchard genotype i and the genes among the migration pollen is θ iM, this is also the chance that an contaminating pollen and a gene originating from seed orchard genotype i are identical by descent. It is assumed that the rate of pollen contamination the same for all seed parents. For the calculation of group coancestry of the seed orchard crop, there are three sources of successful gametes to consider: (1) gametes from seed parents, which are all in the seed orchard; (2) gametes from pollen parents in the orchard; and (3) migrating pollen. As half the successful gametes come from the seed parents and half from the pollen parents, the summed fractions from seed parents and pollen adds up to 0.5, respectively. For the pollen gametes there are two sources, M is migrants with the contaminating pollen and 0.5(1-2M) comes from seed orchard clones, these two sources add up to 0.5 together. There are nine possible ways two successful gametes can be combined from these three sources; they are all listed in Table 1. The table can be considered as a symmetric matrix demonstrating the different cases in which two genes from the gene pool of the seed orchard crop can be compared for identity of decent. The share for the nine different cases is obtained by multiplying the share of the gamete origins. The sums in the table express the probability IBD will occur, given the case. The elements in Table 1 consider both the share of the case and the probability for IBD, given the case. The overall probability for IBD (= group coancestry) can be obtained by summing over all cases. Table. The different cases two genes from the gene pool of a seed orchard crop can be obtained, their frequency and their incidence of IBD. Case and probability for a gene; and for another. 1) Seed parent gamete, p = 0.5 1) 0.5 0.25 f j ij 2) 0.5(1-2M) 0.25(1-2M) f i m j ij 3) M 0.5M f i iM 2) Seed orchard pollen parent gamete, p=0.5(1-2M) 0.25(1-2M) f i m j ij 0.25(1-2M)2 mi m j ij 0.5M(1-2M) mi iM 3) Migrating pollen parent gamete, p=M 0.5M f i iM 0.5M(1-2M) mi iM M2 f i MM As the table is symmetric, only six distinct cases are shown in the table: 1) Two seed parent gametes; 2) one seed parent gamete and one orchard pollen parent gamete; 3) one seed parent gamete and one migration gamete, 4) two seed orchard pollen gametes; 5) one seed orchard pollen gamete and one migrating gamete; 6) two migrating gametes. These cases appear as six separate terms in the summation to get the overall probability of IBD: 0.25 f i f j ij 0.5(1 2M ) f i m j ij M f i iM i j 0.25(1 2 M ) i 2 i mi m j ij (1 2M )M mi iM M 2 MM i LAST EDITED 03-05-02 j j FILE: SEEDORCHDIVBOOK i PAGE 6 [2] The group coancestry can be reorganised in three terms: the first refers to the case when the two compared gametes both originate from seed orchard clones, the second for one gamete is a seed orchard clones and the other a migrant; and the third that there are two migrant gametes (pollen): 0.25 f i f j ij 0.5(1 2 M ) f i m j ij 0.25(1 2 M ) 2 mi m j ij i j i j i j M f i iM (1 2 M ) mi iM M 2 MM [3] i i 0.25 ( f i (1 2 M )mi )( f j (1 2 M )m j ) ij M ( f i (1 2 M )mi ) iM M 2 MM i j i By this organisation, the influence of relatedness involving the contaminating pollen becomes evident. 200 Status number in a seed orchard with 50 clones exposed to pollen contamination 180 The effect of pollen contamination on status number in a seed orchard crop is demonstrated in the Figure to the right. The seed orchard comprises 50 unrelated clones with equal fertility. Status number raises fast with increasing pollen contamination. Pollen contamination is important for gene diversity. 160 Status number Exemplifying figures on Pollen contamination 140 120 100 80 60 NS 40 1 N 2 (1 M ) 2 20 0 0 0.1 0.2 0.3 0.4 0.5 0.6 0.7 0.8 0.9 1 Pollen contamination The effect of contaminating pollen on status number is influenced by relatedness in the contaminating pollen. The relatedness in the example is only θMM=0.01, this is not more than how much more related a local provenance can be expected to be compared to relatedness in the larger area the plus-trees are drawn from. The upper weak curve corresponds to unrelated contaminating pollen to serve as a reference. Even a weak relatedness of the contaminating pollen has a considerable influence. LAST EDITED 03-05-02 FILE: SEEDORCHDIVBOOK Status number 200 180 Status number in a seed orchard with 50 clones exposed to pollen 160 contamination with relatedness. 140 120 100 80 60 40 NS 20 N 2M MM (1 M ) 2 2 0 0 0.1 0.2 0.3 0.4 0.5 0.6 0.7 0.8 0.9 1 7 Pollen contamination PAGE The migrating pollen does not introduce relatedness If the contaminating pollen is not related to itself neither to the seed orchard genotypes, the second and third terms vanish as θ MM = θ iM = 0. From formula [3], group coancestry for the first case, where both gametes come from the seed orchard, can be reformulated in a term for seed parents, one for pollen parents and one for their interaction. The group coancestry considering pollen contamination, which does not introduce relatedness, becomes 0.25 ( f i (1 2 M )mi )( f j (1 2 M )m j ) ij i [4] j Absence of relatedness or inbreeding among seed orchard clones Consider a seed orchard composed of unrelated and non-inbred clones. The probability for identity by descent for genes from genotype i is the probability that both genes originate from the genotype times the probability that they are identical if they do. The latter is 0.5, thus the self-coancestry for non-inbred genotypes. It the genes do not come from the same genotype they are unrelated, and thus does not contribute to the sum of all coancestry contributions. The group coancestry is obtained by summation over all seed orchard genotypes N 0.25 ( f i (1 2 M ) mi ) 2 0.5 [5] i 1 Pollen parents and seed parents has no fertility variation within gender Formula [5] is developed for a further special case. A number of seed parents (Nf) each contribute fi=1/Nf to the gene pool and Nm pollen parents each contribute (disregarding contamination) mi=1/Nm. Some genotypes can be both seed parents and pollen parents, this number is designed Nmf. There are no relatedness and no inbreeding among the orchards genotypes and no genetic relationships involving the migrating pollen. The fertility of parents is implicitly included in mi and fi. The census number of parents (N) can be expressed as a function of Nm, Nf, and Nfm. Note that Nfm can be the same as Nm or Nf, but cannot be larger than the smaller of them. N 0.25 (1 / N f (1 2 M ) / N m ) 2 0.5 i 1 N m (1 2 M ) 2 N f 2(1 2M ) N fm [6] 8N f N m The fertility is the same for seed parents and pollen parents If mi = fi (thus the fertility is the same as seed parent and pollen parent), formula [3] can be rewritten as (1 M ) 2 f i f j ij 2M (1 M ) f i iM M 2 MM [7] i LAST EDITED 03-05-02 j FILE: SEEDORCHDIVBOOK i PAGE 8 For the case that the contaminating pollen is not related neither to itself, nor to the seed orchard genotype, Formula [7] becomes (1 M ) 2 f i f j ij . i j The later factor of that expression is the same as what the group coancestry would have become in the absence of contamination. Thus group coancestry in the presence of contamination can, provided the contaminating pollen does not involve relatedness and the fertility is equal for both sexes, be written: (1 M ) 2 ' There Θ’ indicates what group coancestry would have been if there was no pollen contamination. N The concept sibling coefficient, Ψ, was introduced as a measure of fertility variation, N f i (Kang and 2 i Lindgren 1999). Here the use of sibling coefficient is constrained to the case mi = fi., but the use of sibling coefficient was extended by e. g. Kang, Lindgren and Mullin (2001). In the absence of relatedness or inbreeding among clones or relatedness with the contaminating pollen and when a clone has the same fertility for both genders the following expression is obtained, (1 M ) 2 f i 2 0.5 (1 M ) 2 0.5 / N i The status number and the effective number of parents can be written NS NP 1 N . 2 (1 M ) 2 Variance effective population size The variance effective population size of an orchard can be used to describe the likely drift of gene frequencies between the orchard clones and the seed orchard offspring. The variance effective population size (Ne(v)) is a function of fertility variation and number of orchard genotypes. It can be described with group coancestry (including gene migration if it is assumed the migrating genes have the same gene frequency as the orchard clones) as N e( v ) 2( 1) . However, this is not a recommended way of describing a seed orchard (Lindgren and Mullin 1998). LAST EDITED 03-05-02 FILE: SEEDORCHDIVBOOK PAGE 9 Application of fertility variation described as a power function An example is given in the Figure to the right. A number of clones a 1 with known fertility and sufficient f ( x1 ) ax1 breeding value are candidates for a seed orchard. The fertility of individual clones ranked for their fertility is described by the function f ( x) ax a 1 . Low fertility clones are not desirable in a seed orchard, therefore the lowest fertility share X0 of the clones are not included in the seed orchard. The high fertility clones would jeopardize the gene diversity of the seed orchard and x dominate the seed crop too much, F (a, x0 , x1 ) ax a 1dx x1a x0a ax1a 1 (1 x1 ) x thus the number of ramets is adjusted for the fraction 1-X1 of o 1 the clones with highest fertility to keep the fertility on an acceptable a 1 highest value f ( x1 ) ax1 . Colored area represents the total fertility (can be interpreted as seed crop) calculated by the integral given in the figure, which has a simple solution. Knowing the function, e.g. gene diversity may be calculated for the seed orchard. Fertility 1 0 0 LAST EDITED 03-05-02 FILE: SEEDORCHDIVBOOK x x Fractions of parents PAGE 10 1 Different effective numbers for the same object It is of interest to see how different effective numbers compare for the same seed orchard, this has been done by Kjaer and Wellendorf (1998) for a Norway spruce seed orchard and its crop: Entity Number of clones in seed orchard Status number of the orchard clones Variance effective population size Inbreeding effective population size Status number of the crop Value 100 100 236.7 18.1 70.4 Note that the effective population size expresses changes between the 100 parental clones and their progeny, while the status number expresses the relationship between the orchard seeds and the base population with unrelated non inbred trees (the “wild forest”) the seed orchard clones were drawn from. Seed orchard management formulas Assumptions: unrelated, non-inbred clones Initial number of clones Selective harvesting Group coancestry – all clones equally fertile 0.5(1 M ) 2 N ( N (1 2M )(3 2M ) N mother ) 8 NN mother Clones unequally fertile 0.5(1 M ) 2 N mother Genetic thinning Genetic thinning followed by ( N father (1 2 M )(3 2 M ) N mother ) selective harvest 8N N mother Different (or partly different) Seed and pollen parents father ( N father (1 2M ) N mother 2(1 2M ) N mf ) 2 8 N mother N father End note: Gain and the balance between gain and gene diversity and inbreeding is the among most important considerations in seed orchards. This becomes especially important in advanced generation orchards, when candidates for the orchards tend to be related and it may be motivated to include relatives in orchards. These matters will be developed in later chapter, first the matters of gene diversity, gain and their balance most be introduced in general terms. LAST EDITED 03-05-02 FILE: SEEDORCHDIVBOOK PAGE 11 Examples: Setting; You are the responsible manager for a seed orchard of Pinus scotch var. whiskeys, and receive the questions listed below from your boss for consideration concerning the wisest seed orchard management. The seed orchard has 100 unrelated and non-inbred clones from the initial plus-tree selection, and pollen contamination is 40%. Contamination pollen contributes equally to all clones. Example 1 1-1.What are the predicted status number (Ns) and gene diversity (GD) when seeds are harvested only from the best 10 clones without any genetic thinning? 1-2. What about genetic thinning with removing of 90% inferior clones? Thus, the 10 % best clones remains. 1-3. Compare the two management regimes given above as regards gene diversity in the seeds. What genetic thinning will be required to get the same gene diversity as in Example 1-1? Example 2 Now, you get the information of fertility variation (in terms of CV) among parents, which is estimated to 100%. 2-1) What is variance effective population size (Ne(v)) if the seeds are collected from the best 50% clones without genetic thinning? 2-2) How about when the seeds are harvested from the remaining clones after genetic thinning of 50 % inferior clones? 2-3) If the seeds are collected from 20 best clones after the 50 % thinning? Example 3 The seed orchard is genetically thinned down to 40 clones, a part of the seed orchard is completely replanted with 10 ten of the clones which remain in the seed orchard and 10 other clones. Seeds are harvested from the new planted part before pollen production where has become important (thus the orchard pollen comes from the 40 clones around). Another problem, which get the same answer is: there are 50 clones remaining in the seed orchard. There is a sexual asymmetry so 40 of the clones produce pollen and 20 seeds. The male fertility and female fertility are the same for all clones which has a reproductive output. What are the values of Ns? Speculate about under what condition the gain estimates given in the worksheet are relevant! Answers can be found in the workbook ORCHARD_MANAGEMENT_2003.xls. Other examples and solutions may be available from http://www.genfys.slu.se/staff/dagl/Breed_Home_Page/Tutorials/Tutorial_Menu.htm Webplaces of special interest for this chapter Seed orchards in general are dealt with on the TBT site http://www.genfys.slu.se/staff/dagl/Breed_Home_Page/Orchard_manager/ Some of the figures in this chapter are discussed or evaluated at ..\EXCEL\BookFiguresSeedOrchard03.xls Specific literature References and other literature can be found in the chapter.... Some references and other literature of special interest for this chapter are listed below Lindgren D. & Mullin T.J. 1998. Relatedness and status number in seed orchard crops. Canadian Journal of Forest Research 28: 276-283. Ruotsalainen, S. Lindgren, D. & Mullin, T.J. 2000. Some formulas concerned with pollen contamination have constrained use in Lindgren and Mullin (1998). Relatedness and LAST EDITED 03-05-02 FILE: SEEDORCHDIVBOOK PAGE 12 status number in seed orchard crops. Canadian Journal of Forest Research 30: 333. Kang, KS, Lindgren.D & T.J. Mullin. 2001. Prediction of genetic gain and gene diversity in seed orchard crops under alternative management strategies. TAG 103;1099-1107. Kang, K.S. 2001. Genetic gain and gene diversity of seed orchard crops. Acta Universitatis Agriculturae Sueciae. Silvestria 187 75pp+ 11 chapters. LAST EDITED 03-05-02 FILE: SEEDORCHDIVBOOK PAGE 13


