Formative Guide 4
advertisement
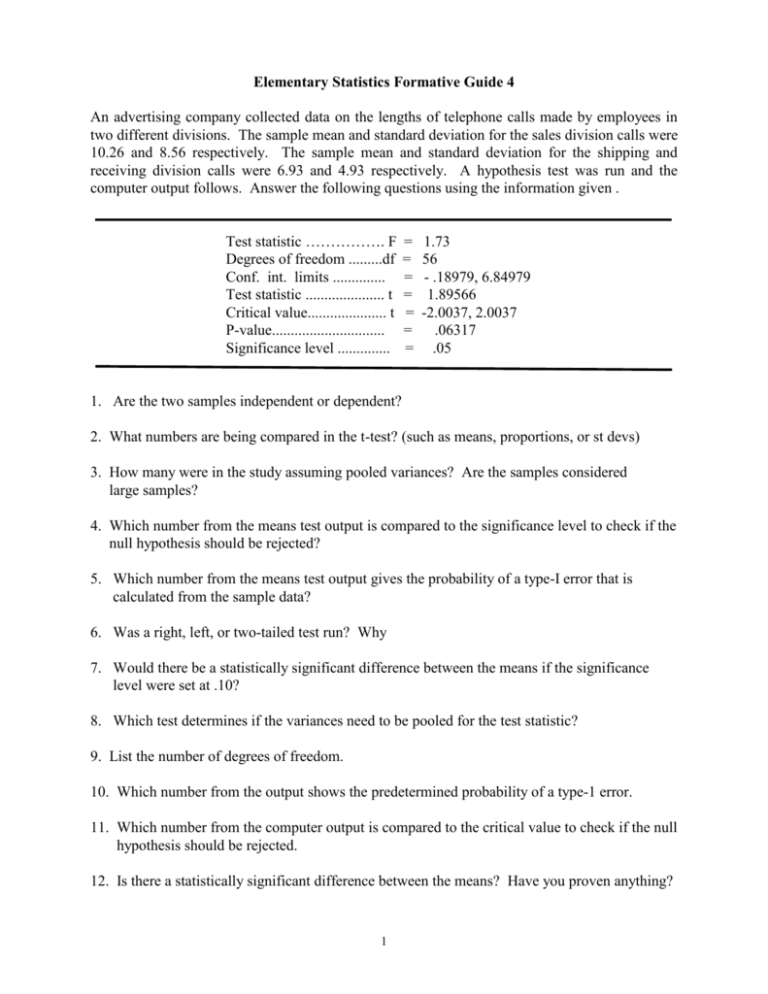
Elementary Statistics Formative Guide 4 An advertising company collected data on the lengths of telephone calls made by employees in two different divisions. The sample mean and standard deviation for the sales division calls were 10.26 and 8.56 respectively. The sample mean and standard deviation for the shipping and receiving division calls were 6.93 and 4.93 respectively. A hypothesis test was run and the computer output follows. Answer the following questions using the information given . Test statistic ……………. F Degrees of freedom .........df Conf. int. limits .............. Test statistic ..................... t Critical value..................... t P-value.............................. Significance level .............. = = = = = = = 1.73 56 - .18979, 6.84979 1.89566 -2.0037, 2.0037 .06317 .05 1. Are the two samples independent or dependent? 2. What numbers are being compared in the t-test? (such as means, proportions, or st devs) 3. How many were in the study assuming pooled variances? Are the samples considered large samples? 4. Which number from the means test output is compared to the significance level to check if the null hypothesis should be rejected? 5. Which number from the means test output gives the probability of a type-I error that is calculated from the sample data? 6. Was a right, left, or two-tailed test run? Why 7. Would there be a statistically significant difference between the means if the significance level were set at .10? 8. Which test determines if the variances need to be pooled for the test statistic? 9. List the number of degrees of freedom. 10. Which number from the output shows the predetermined probability of a type-1 error. 11. Which number from the computer output is compared to the critical value to check if the null hypothesis should be rejected. 12. Is there a statistically significant difference between the means? Have you proven anything? 1 Elementary Statistics Formative Guide 4 13. The test statistic used to test the differences between two sample means a.) t b.) r c.) chi-square d.) F 14. If the null hypothesis is that the population mean is equal to 100 and a sample mean of 123 gave significant support against the null hypothesis, which of the following sample means would be certain to give support against the null hypothesis. a.) 100 b.) 122 c.) 126 d.) 44 15. If you were trying to test for an average increase in student understanding of statistical knowledge over a 15 week period, the most appropriate test would be. a.) one sample mean b.) chi-square c.) F test d.) independent two sample mean e.) dependent two sample mean 16. The probability of getting a value as extreme as that found in the sample when the null hypothesis is true is the. a.) p - value b.) critical value c.) significance level d.) test statistic 17. If the p-value is less than the significance level, you would . a.) accept the null hypothesis b.) accept the alternative hypothesis c.) accept the significance level d.) accept the test statistic 18. If one particular .95 CI for the mean extends from 43.73 to 85.71, which of the following statistical hypotheses would be accepted at the .05 level? a.) u=115 b.) u=15 c.) u=85.9 d.) u=65 e.) u=165 19. The t-test should always be used to test a null hypothesis about a population mean when the sample size is. a.) >20 b.) >30 c.) <30 d.) <40 20. If the null hypothesis has been accepted and there truly exists a significant difference, what type of error has been made? a.) type I b.) type II c.) sampling d.) measurement 21. If a directional hypothesis is legitimate, which will have greater power? a.) a two-tailed test b.) a one-tailed test c.) both will have the same power d.) you can’t run a two tailed test 2 Elementary Statistics Formative Guide 4 a) ________ 22) Test the claim that Ho: u > 100, given a sample size of 22 for which the mean b)________ is 95 and the standard deviation is 18. Use a significance level of 0.05. List c) ________ the a) test statistic b) p-value and c) whether you reject or accept the null hypothesis. a)________ 23) The Mill Valley Brewery distributes soda bottles labeled 32 oz. The Bureau of b)________ Weights and Measurements randomly selects 50 of these bottles and measures c)________ their contents. They obtain a sample mean of 31.8 oz and a sample standard deviation of 0.75 oz. Using a 0.01 level of significance, test the Bureau’s claim that the brewery is cheating consumers. List the a) test statistic b) p-value and c) whether you think the brewery is cheating the consumer or not. a)________ 24) Test a claim that a population proportion is p = .3. Use the sample data b)________ results from a sample size of 180 people that show a sample proportion of c)________ p = .285. Use a .05 level of significance. List the a) test statistic b) p-value and c) whether you accept or reject the null hypothesis. a)________ 25) In a clinical study of the allergy drug Seldane, 70 of the 781 subjects b)________ experienced drowsiness. Fifty out of the 543 subjects that tested Singulair experienced drowsiness. Test the claim that drowsiness is experienced equally between both allergy medications. Use a .10 significance level. List the a) pvalue and b) conclusion. a)_______ 26) A pretest/posttest design was used to test a new weight-gain product. The table b)________ below lists the before and after weights for the 7 participants. Use a .01 level of c)________ significance to test the claim that there was a significant increase in weight. List the a) test statistic b) p- value and c) whether there was significant weight gain. Student Beginning Weight Ending Weight 1 112 2 156 3 127 4 133 5 206 6 171 7 222 121 154 140 141 248 183 191 a)________ 27) Two different types of automobiles were compared on braking distance. b)________ The mean and standard deviation for the one type of auto was 104 and 13.7 c)________ respectively. The mean and standard deviation for the other type of auto was 118 and 9.7 respectively. Both used a sample size of 15 cars. Use a .05 significance level and test the claim that the braking distances are the same for both types of automobiles. List the a) test statistics b) p-value and whether the types of automobiles have different braking distances. 3


