Homework 8 Chi
advertisement
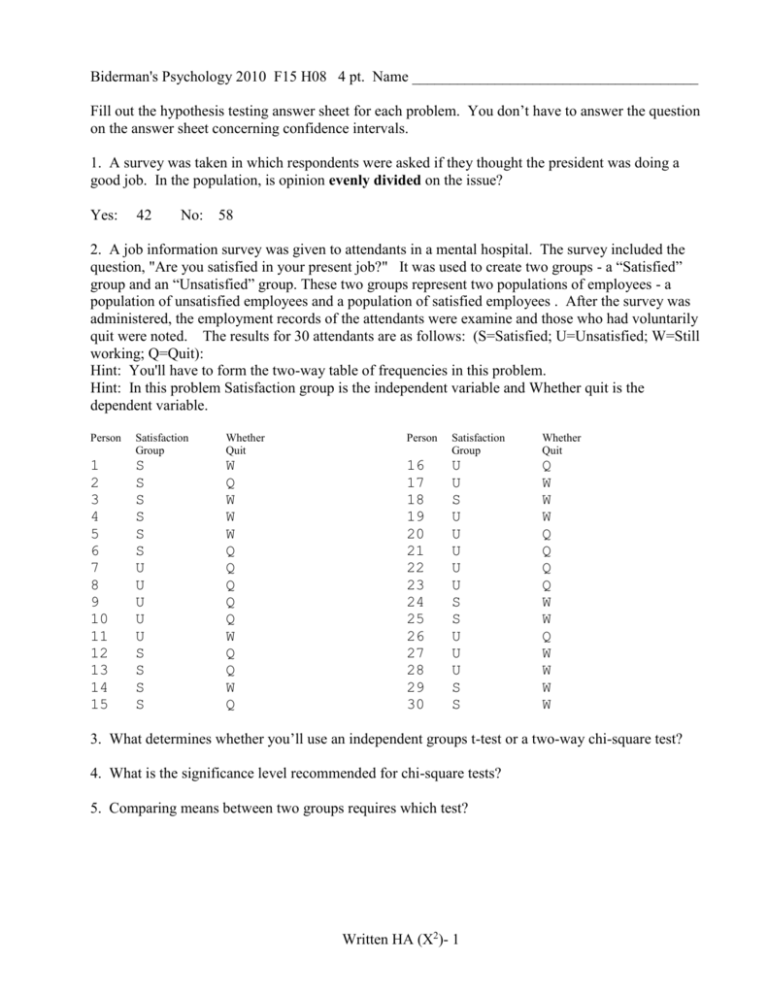
Biderman's Psychology 2010 F15 H08 4 pt. Name ______________________________________ Fill out the hypothesis testing answer sheet for each problem. You don’t have to answer the question on the answer sheet concerning confidence intervals. 1. A survey was taken in which respondents were asked if they thought the president was doing a good job. In the population, is opinion evenly divided on the issue? Yes: 42 No: 58 2. A job information survey was given to attendants in a mental hospital. The survey included the question, "Are you satisfied in your present job?" It was used to create two groups - a “Satisfied” group and an “Unsatisfied” group. These two groups represent two populations of employees - a population of unsatisfied employees and a population of satisfied employees . After the survey was administered, the employment records of the attendants were examine and those who had voluntarily quit were noted. The results for 30 attendants are as follows: (S=Satisfied; U=Unsatisfied; W=Still working; Q=Quit): Hint: You'll have to form the two-way table of frequencies in this problem. Hint: In this problem Satisfaction group is the independent variable and Whether quit is the dependent variable. Person Satisfaction Group Whether Quit Person Satisfaction Group Whether Quit 1 2 3 4 5 6 7 8 9 10 11 12 13 14 15 S S S S S S U U U U U S S S S W Q W W W Q Q Q Q Q W Q Q W Q 16 17 18 19 20 21 22 23 24 25 26 27 28 29 30 U U S U U U U U S S U U U S S Q W W W Q Q Q Q W W Q W W W W 3. What determines whether you’ll use an independent groups t-test or a two-way chi-square test? 4. What is the significance level recommended for chi-square tests? 5. Comparing means between two groups requires which test? Written HA (X2)- 1 Corty Hypothesis Testing Answer sheet. Name ________________________________________ H08 Problem 1 1-1. Give the name of the test statistic that will be employed to test the null hypothesis. 1-2. Do the data meet the assumptions of the test? Provide evidence. 1-3. The null and alternative hypotheses. Null Hypothesis:________________________________________________________________ Alternative Hypothesis:__________________________________________________________________ 1-4. What significance level will you use to separate "likely" value from "unlikely" values of the test statistic? Significance Level = ___________________________________________________________ 1-5. What is the value of the test statistic computed from your data and the p-value? Test statistic value = _________________________ 1-6. What is your conclusion? p-value = _____________________ Do you reject or not reject the null hypothesis? 7. What are the upper and lower limits of a 95% confidence interval appropriate for the problem? If a Confidence interval is not appropriate for this problem, say so. Lower Limit = _________________________ Upper Limit = _______________________ 1-8. State the implications of your conclusion for the problem you were asked to solve. That is, relate your statistical conclusion to the problem. Written HA (X2)- 2 Corty Hypothesis Testing Answer sheet. Name ________________________________________ H08 Problem 2 2-1. Give the name of the test statistic that will be employed to test the null hypothesis. 2-2. Do the data meet the assumptions of the test? Provide evidence. 2-3. The null and alternative hypotheses. Null Hypothesis:________________________________________________________________ Alternative Hypothesis:__________________________________________________________________ 2-4. What significance level will you use to separate "likely" value from "unlikely" values of the test statistic? Significance Level = ___________________________________________________________ 2-5. What is the value of the test statistic computed from your data and the p-value? Test statistic value = _________________________ 2-6. What is your conclusion? p-value = _____________________ Do you reject or not reject the null hypothesis? 7. What are the upper and lower limits of a 95% confidence interval appropriate for the problem? If a Confidence interval is not appropriate for this problem, say so. Lower Limit = _________________________ Upper Limit = _______________________ 2-8. State the implications of your conclusion for the problem you were asked to solve. That is, relate your statistical conclusion to the problem. 3._______________________________________________________________________________ 4._______________________________________________________________________________ 5._______________________________________________________________________________ Written HA (X2)- 3


