Real-time detection of influenza A virus using semiconductor
advertisement
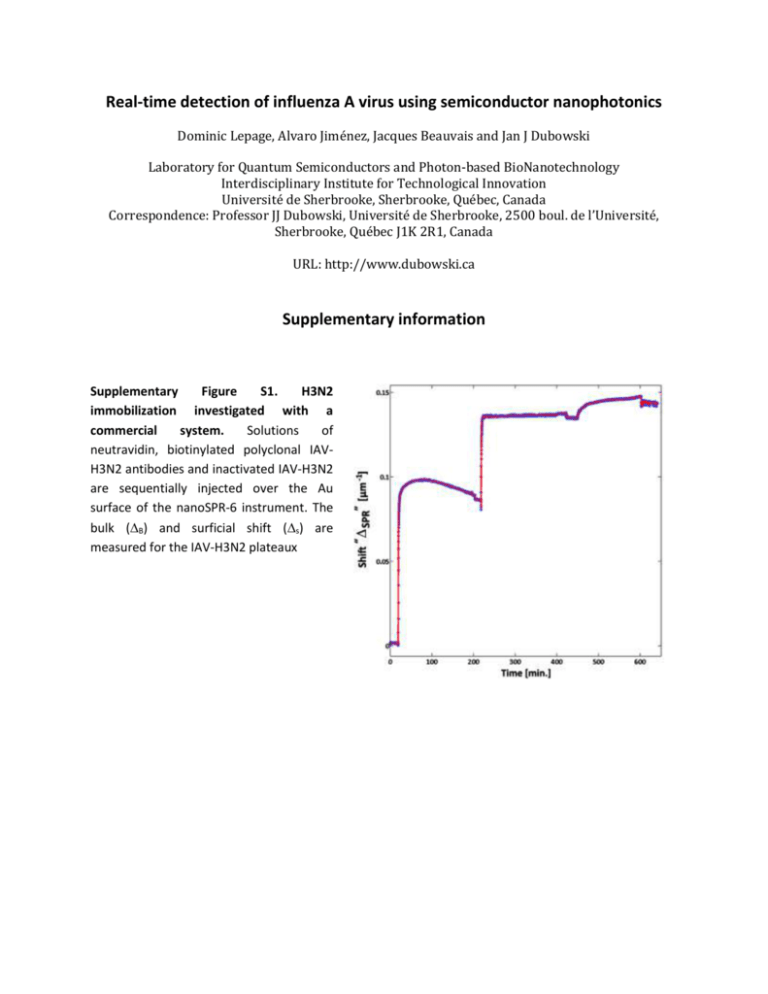
Real-time detection of influenza A virus using semiconductor nanophotonics Dominic Lepage, Alvaro Jiménez, Jacques Beauvais and Jan J Dubowski Laboratory for Quantum Semiconductors and Photon-based BioNanotechnology Interdisciplinary Institute for Technological Innovation Université de Sherbrooke, Sherbrooke, Québec, Canada Correspondence: Professor JJ Dubowski, Université de Sherbrooke, 2500 boul. de l’Université, Sherbrooke, Québec J1K 2R1, Canada URL: http://www.dubowski.ca Supplementary information Supplementary Figure S1. H3N2 immobilization investigated with a commercial system. Solutions of neutravidin, biotinylated polyclonal IAVH3N2 antibodies and inactivated IAV-H3N2 are sequentially injected over the Au surface of the nanoSPR-6 instrument. The bulk (B) and surficial shift (s) are measured for the IAV-H3N2 plateaux Supplementary Figure S2. H3N2 immobilization investigated with a QW-SPR device. a, The dispersion relation in E(kll) of the diffracted SPs is recorded as a hyperspectral cube at a given time. The distance between the two surfaces is measured, in time, to assess the changes induced by the neutravidin, biotinylated polyclonal IAV-H3N2 antibodies and inactivated IAV-H3N2. The intensity is given in logarithm scale. b, The SPR shift SPR(E)|ky, in µm-1, as a function of energy and time, as the solutions are injected. c, The same data collection, this time distributed over the in-plane wavevector ky as a function of time. The color scale represents the SPR shift, SPR(ky)|E, in µm-1. d, The same dataset compressed into a 2D graph comparable to Fig. 4 (see main text), where bulk (B) and surficial shift (s) for the IAV-H3N2 plateaux are measured. Lepage et al., Real-time detection of influenza A virus using semiconductor nanophotonics, LSA, 2013 2 Supplementary Figure S3. Conic measurement of BSA physisorption on a QW-SPR device. a, SPR as a function of E-ky and time, as the solutions are injected over the device and rinsed. The periodic modulations in E-ky are attributed to the interactions of the SPs with the grating as predicted in the literature,15,16 b, Cumulative SPR shift in time for the IAV-H3N2 adsorption, where the bulk (B) and surficial shift (s) are measured. Lepage et al., Real-time detection of influenza A virus using semiconductor nanophotonics, LSA, 2013 3 Table S1 Specifications and performance of all the presented systems. The hyperspectral method can be employed for “Real” mapping, that is a spatial (x-y) cartography of the photoluminescence intensity as a function of energy (E). However, the kinetic mirror in figure 3 can also be activated in order to collect a “conjugated” map, that is a wavevector (kx-ky) cartography of the photoluminescence intensity as a function of energy (E). This mode of operation is employed to directly record the dispersion properties of surficial scattering of SPs. A simplified version of this mapping mode is the “Conic” approach, which can also be employed for the collection of information on the SPs dispersion. The commercial system of comparison in this case is the nanoSPR6 system, a Kretschmann-Raether prismbased system. Information originally presented in D. Lepage et al., Light Sci. Appl. 1, e28; doi:10.1038/lsa.2012.28 (2012). Conjugate Hyperspectral Commercial nanoSPR6 Full scan Conic section Single GaAs Single GaAs Source Solid-state laser Quantum well Quantum well Excitation energies (eV) 1.91 1.38 to 1.65 1.38 to 1.65 Mean scan time (s) 5 > 360 < 2.4 Max. dataset per pts. 808 489.3M 3.2M Mean dataset per pts. 808 27.2M 1.6M Table S2 Summary of SPR shifts SPR for the various measurement methods. All shifts have been translated into 1∙10-4 µm-1 units for comparison purposes. The bulk and surficial shifts, B and S respectively, are determined by fitting the physisorption data to an exponential growth-saturation model exposed in the text. The SNR of the methods are estimated by smoothing the collected results with a moving average filter. The geometric mean of the ratio between the signal and noise defines the SNR and the geometric standard deviation is used to represent the uncertainty on the estimated SNRs. B(BSA) [1∙10-4 µm-1] s(BSA) [1∙10-4 µm-1] B(H3N2) [1∙10-4 µm-1] s(H3N2) [1∙10-4 µm-1] SNR Commercial nanoSPR6 1081 ± 3 519 ± 3 124 ± 4 92 ± 7 501 ± 13 Conjugate Hyperspectral Full scan Conic section 23300 ± 300 7569 ± 7 11400 ± 300 7140 ± 10 6600 ± 100 350 ± 10 5700 ± 200 330 ± 10 615 ± 16 1831 ± 12 Lepage et al., Real-time detection of influenza A virus using semiconductor nanophotonics, LSA, 2013 4 Molecular masses on the surface: BSA: We used 20 mg/ml and the BSA molar mass is 66463g/mol. Therefore, 20 103 g / ml 3.029 107 mol / ml 0.3M 66463g / mol (A.1) In “AFM study of BSA adlayers on Au stripes”, Applied Surface Science, 253(23), p.9209 (2007), 15µM and 1.5µM are used for 36 hours, which are 50 and 5 times higher concentrations than we have and for 12x the time period. As they conclude, and supported by their AFM measurements: they saturate the surface with BSA. This yields 1.976 ng of material over 1mm2 area (BSA mass density =9.4095∙105 g/m3). Using ellipsometry with concentrations of 0.03 mg/ml (450pM), R.M.A. Azzam et al. In Phys. Med. Biol., 22(3), p.422 (1977) have found 0.75 ng of material over 1mm2. Extrapolating for our concentrations, we estimate the surface coverage to be 994.9 pg/mm2. Focus on Eye Research, by O. R. Ioseliani (2006), Nature 173, p.821 (1954) and Appl. Opt. 38, p.4058 (1999) allows estimating the “bulk” refractive index change of BSA in PBS solution to be 0.1845cm3/g∙20∙10-3g/ml= 0.0037 RIU. That is to say that 0.3µM of BSA in PBS (nPBS =1.3332 at 650 nm and 1.3293 at 870nm) has nBSA2% =1.3369 at 650 nm and 1.3330 at 870 nm. From Phys. Med. Biol. 22(3) p.22 422 (1977), App. Surf. Science, 253, p.9209–9214 (2007) and the : product Information of BSA from sigma-Aldrich, we know the average height of a continuous BSA film is 1.4nm thick. From the same sources, and from App. Spec. 40(3) p. 313-318 (1986), Nanotech. 15 p. 703– 709 (2004) and Microelectronic Eng. 84 p.479–485 (2007), the refractive index of a monolayer of BSA can be described by nBSA()=1.563+3505 , with in nm in the VIR-NIR region. Therefore, after rinsing, for a 0.9949ng/mm2 BSA coverage, nBSA = 1.4531 at 650 nm and nBSA = 1.4493 at 870 nm for the first 1.4 nm and then the SP tail is in PBS. To evaluate the surficial effective shift in refractive index, we take: neff ( ) I SP ( ) n( z , ) z I SP ( ) z nPBS ( ) 0 0 (A.2) neff ( ) nBSA ( ) nPBS ( ) 1 exp( 2 k z ( ) z ' ) (A.3) Where ISP(z) Ez ,the E-Field intensity in z, n(z) the spatial distribution of the refractive index in z and z’ the height of BSA. For the nanoSPR6, this yield a neff = 16.75∙10-4 at 650 nm and 10.39∙10-4 at 870 nm. Therefore, for the nanoSPR6, B = (1081 ± 3)∙10-4 µm-1 for 0.0037 RIU shift, i.e. a 29.22µm-1/RIU sensitivity in “bulk” and 1.03∙10-5 RIU resolution (NanoSPR Inc. claims 2∙10-5 RIU sensitivity). The surface sensitivity s = (519 ± 3)∙10-4 µm-1 for 16.75∙10-4 RIU shift. Thus, a 149.85 µm-1/RIU surficial sensitivity and 9.68∙10-6 RIU resolution. Lepage et al., Real-time detection of influenza A virus using semiconductor nanophotonics, LSA, 2013 5 For the QW-SPR full dispersion, we thus have B = (23300 ± 300)∙10-4 µm-1 for 0.0037, i.e. a 629.73µm1 /RIU sensitivity in “bulk” or 4.76∙10-5 RIU resolution. The surface sensitivity s = (11400 ± 3)∙10-4 µm-1 for 10.39∙10-4 RIU shift, i.e. a 11334µm-1/RIU surficial sensitivity and 2.65∙10-5 RIU resolution. For the QW-SPR conic dispersion, we thus have B = (7569 ± 7)∙10-4 µm-1 for 0.0037, i.e. a 204.56µm1 /RIU sensitivity in “bulk” or 3.42∙10-6 RIU resolution. The surface sensitivity s = (7140 ± 6)∙10-4 µm-1 for 10.39∙10-4 RIU shift, i.e. a 7099µm-1/RIU surficial sensitivity and 1.45∙10-6 RIU resolution. H3N2: From J. Gen. Virol. (1984), 65, p.799, the average mass of the influenza A virus is (174±34)∙106 Da. Given that we observe an average of 5 virus/µm2, this equals to 5x 2.8893∙10-16 g / (10-6 mm2) = 1.45 ng/mm2. In the literature, we have not found relevant values for the refractive index values of deactivated influenza capsids. Of the 1.45ng/mm2, a great fraction of this mass comes from PBS within the capsids, which are porous to the puffer. Thus, the effective refractive index contribution only comes from the shell and the genetic material. In addition to surface coverage, this is one of the main reasons why H3N2 in PBS doesn’t yield much shift. In fact, we can use the BSA results to infer a 5.5843∙10-5 RIU shift from the 1.45 ng/mm2 H3N2 coverage. The instrument can be employed to infer the effective refractive index of PBS filled H3N2 capsids. However, H3N2 capsids cannot be employed as a rigorous standard of the system’s response since no cross-references are available. Lepage et al., Real-time detection of influenza A virus using semiconductor nanophotonics, LSA, 2013 6

