the potential of insar for volcano deformation monitoring: tenyears of
advertisement
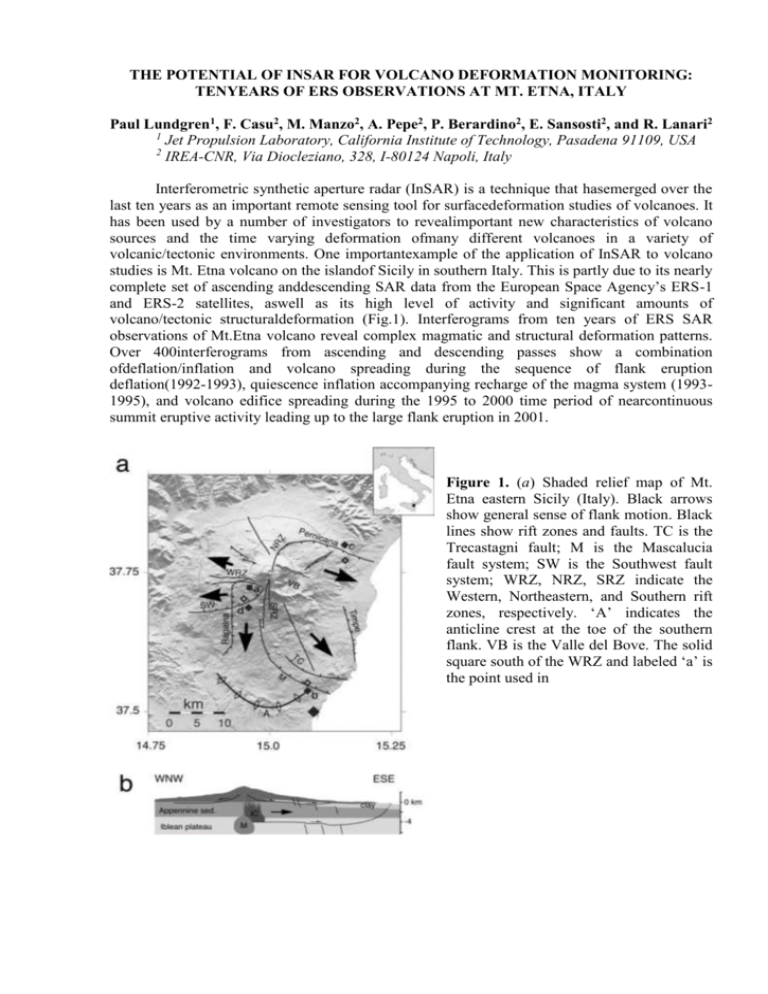
THE POTENTIAL OF INSAR FOR VOLCANO DEFORMATION MONITORING: TENYEARS OF ERS OBSERVATIONS AT MT. ETNA, ITALY Paul Lundgren1, F. Casu2, M. Manzo2, A. Pepe2, P. Berardino2, E. Sansosti2, and R. Lanari2 1 Jet Propulsion Laboratory, California Institute of Technology, Pasadena 91109, USA 2 IREA-CNR, Via Diocleziano, 328, I-80124 Napoli, Italy Interferometric synthetic aperture radar (InSAR) is a technique that hasemerged over the last ten years as an important remote sensing tool for surfacedeformation studies of volcanoes. It has been used by a number of investigators to revealimportant new characteristics of volcano sources and the time varying deformation ofmany different volcanoes in a variety of volcanic/tectonic environments. One importantexample of the application of InSAR to volcano studies is Mt. Etna volcano on the islandof Sicily in southern Italy. This is partly due to its nearly complete set of ascending anddescending SAR data from the European Space Agency’s ERS-1 and ERS-2 satellites, aswell as its high level of activity and significant amounts of volcano/tectonic structuraldeformation (Fig.1). Interferograms from ten years of ERS SAR observations of Mt.Etna volcano reveal complex magmatic and structural deformation patterns. Over 400interferograms from ascending and descending passes show a combination ofdeflation/inflation and volcano spreading during the sequence of flank eruption deflation(1992-1993), quiescence inflation accompanying recharge of the magma system (19931995), and volcano edifice spreading during the 1995 to 2000 time period of nearcontinuous summit eruptive activity leading up to the large flank eruption in 2001. Figure 1. (a) Shaded relief map of Mt. Etna eastern Sicily (Italy). Black arrows show general sense of flank motion. Black lines show rift zones and faults. TC is the Trecastagni fault; M is the Mascalucia fault system; SW is the Southwest fault system; WRZ, NRZ, SRZ indicate the Western, Northeastern, and Southern rift zones, respectively. ‘A’ indicates the anticline crest at the toe of the southern flank. VB is the Valle del Bove. The solid square south of the WRZ and labeled ‘a’ is the point used in Figure 3. a. Solid and open diamonds adjacent the Mascalucia/anticline, ‘b’, Pernicana, ‘c’, and SW, ‘d’, faults show the locations for the time series displacements shown in Fig. 3b, 3c, and 3d, respectively; with displacements calculated as the difference (solid – open). (b) Structural cross section (through the summit) of Mt. Etna. M is the magma body, IC the intrusive complex, and ‘clay’ the sub-Etnean clay layer. To the left (west) shallow flank fault is interpreted from this study 19 Sep. 1993 to 21 Sep. 1999. Solid lines indicate faults and rift zones shown in Fig. 1. Observed anticline growth is indicated in (c). Figure 3. InSAR time series inversion solutions for selected locations shown in Fig.1. Line of sight (satellite range) displacements in panels (ac) are from the ascending time series, while panel (d) is from the descending time series solution. (a) Motion of the area of maximum deflation/inflation, showing the deflation accompanying the flank eruption that ended in


