Financial report as of 31 December 2013
advertisement
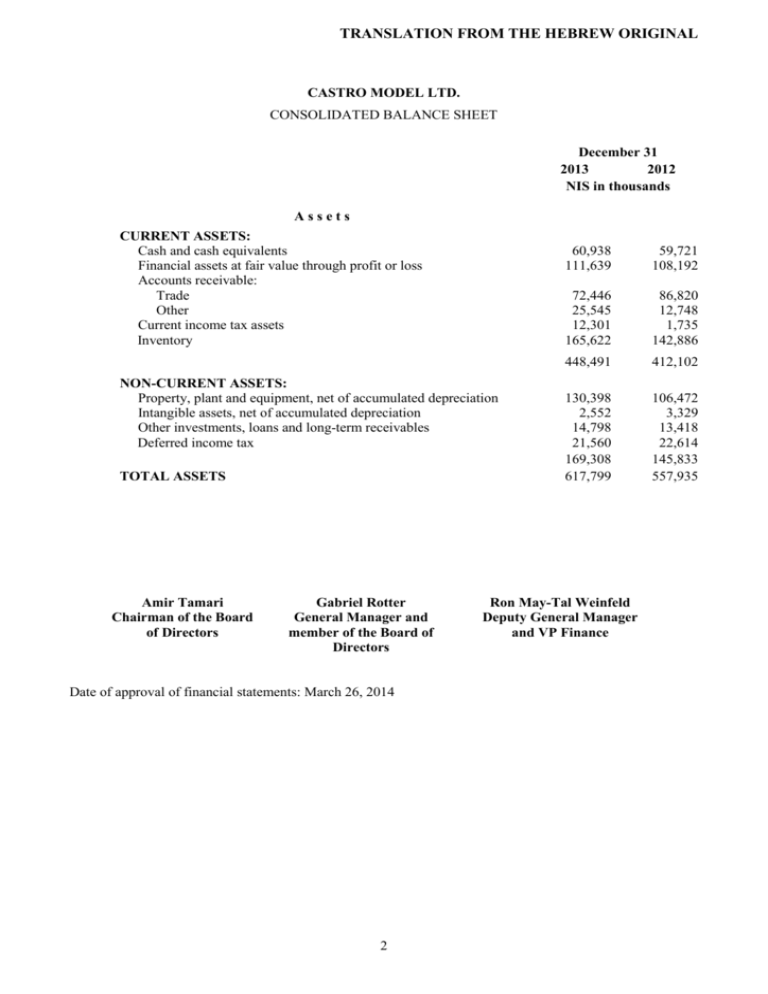
TRANSLATION FROM THE HEBREW ORIGINAL CASTRO MODEL LTD. CONSOLIDATED BALANCE SHEET December 31 2013 2012 NIS in thousands Assets CURRENT ASSETS: Cash and cash equivalents Financial assets at fair value through profit or loss Accounts receivable: Trade Other Current income tax assets Inventory NON-CURRENT ASSETS: Property, plant and equipment, net of accumulated depreciation Intangible assets, net of accumulated depreciation Other investments, loans and long-term receivables Deferred income tax TOTAL ASSETS Amir Tamari Chairman of the Board of Directors Gabriel Rotter General Manager and member of the Board of Directors Date of approval of financial statements: March 26, 2014 2 60,938 111,639 59,721 108,192 72,446 25,545 12,301 165,622 86,820 12,748 1,735 142,886 448,491 412,102 130,398 2,552 14,798 21,560 169,308 617,799 106,472 3,329 13,418 22,614 145,833 557,935 Ron May-Tal Weinfeld Deputy General Manager and VP Finance TRANSLATION FROM THE HEBREW ORIGINAL December 31 2013 2012 NIS in thousands Liabilities and shareholders’ equity CURRENT LIABILITIES: Current maturities of long term bank loans Financial derivative instrument Accounts payable and accruals: Trade Other Deferred income Accruals 30,367 46 46,932 3,825 40,681 63,807 38,041 600 40,192 44,101 35,913 443 173,542 171,406 90,370 1,778 11,430 59,599 1,126 10,789 103,578 71,514 TOTAL LIABILITIES 277,120 242,920 EQUITY Ordinary share capital Share premium Other capital reserves Retained earnings Net of cost of company shares held in Treasury TOTAL EQUITY TOTAL LIABILITIES AND EQUITY 11,262 32,965 (437) 320,414 (23,525) 340,679 617,799 11,262 32,965 (531) 294,844 (23,525) 315,015 557,935 LONG-TERM LIABILITIES: Long-term loans, net of current maturities Deferred income Retirement benefit obligation, net COMMITMENTS AND CONTINGENT LIABILITIES 3 TRANSLATION FROM THE HEBREW ORIGINAL CASTRO MODEL LTD. CONSOLIDATED STATEMENTS OF INCOME For the Year ended December 31 2013 2012 NIS in thousands Revenue, net 774,250 705,858 Cost of revenue 308,711 278,889 Gross profit Selling and marketing expenses 465,539 426,969 363,882 319,219 34,368 33,450 Other income, net 1,380 685 Operating income 68,669 74,985 Finance income 11,976 14,980 Finance costs 14,012 16,939 Finance costs – net (2,036) (1,959) Income before income tax Income tax expense 66,633 73,026 15,605 14,391 Profit for the year 51,028 58,635 10.1 11.6 General and administrative expenses Earnings per share Basic and diluted 4

