Folie mit WIFO-Logo - of Prof Karl Aiginger
advertisement
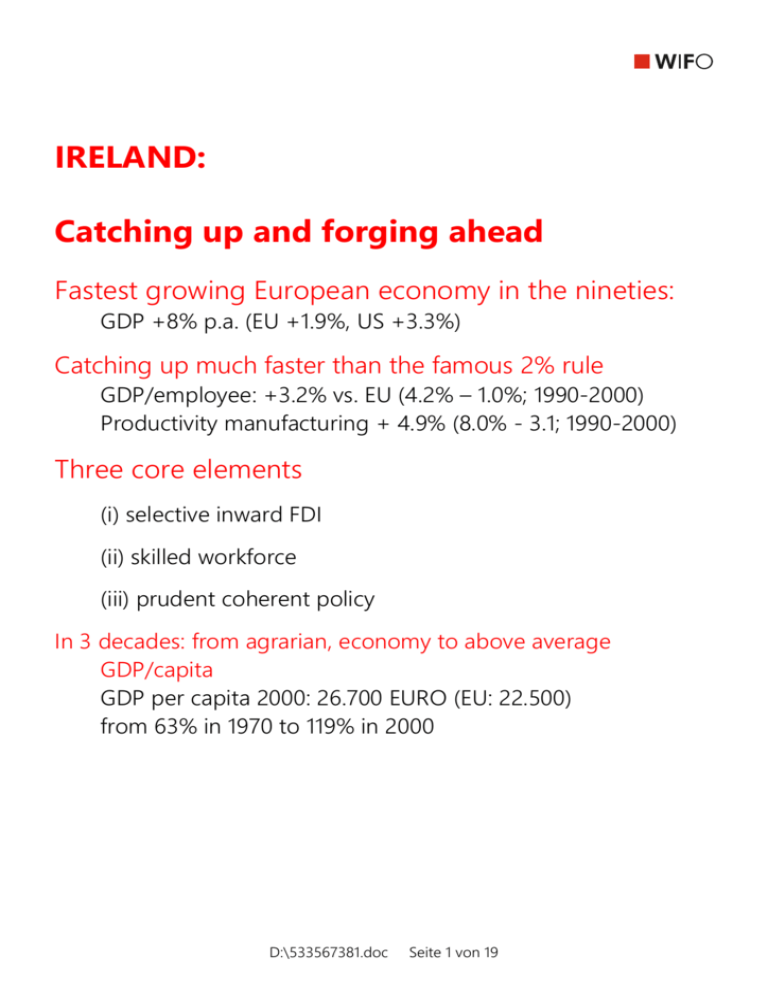
IRELAND: Catching up and forging ahead Fastest growing European economy in the nineties: GDP +8% p.a. (EU +1.9%, US +3.3%) Catching up much faster than the famous 2% rule GDP/employee: +3.2% vs. EU (4.2% – 1.0%; 1990-2000) Productivity manufacturing + 4.9% (8.0% - 3.1; 1990-2000) Three core elements (i) selective inward FDI (ii) skilled workforce (iii) prudent coherent policy In 3 decades: from agrarian, economy to above average GDP/capita GDP per capita 2000: 26.700 EURO (EU: 22.500) from 63% in 1970 to 119% in 2000 D:\533567381.doc Seite 1 von 19 History: Agrarian country Celtic population (Gales) Main product: potatoes Many crisis incl. Famines in 19th century Emigration to US, declining population Land owned by Great Britain Split into protestant North, catholic south Member of EU since 1973 EURO introduced in 2002 (not in UK) D:\533567381.doc Seite 2 von 19 Size, location and income Population: GDP: GDP/capita: GSP: Exports Imports 3.7 mill 102 bn EURO 2000 (1% of EU) 26.700 EURO at PPP 80 bn EURO (difference to GDP: profits to MNE) 94 bn EURO 80 bn EURO Specifity from the European Angle Periphery North-North- East location Hub for re-exports into US Exports to US 13% of GDP (five time EU average) D:\533567381.doc Seite 3 von 19 The roots of the success The deliberate choices: Openness and EU membership Outward orientation Determinedness for change The institutions: Social partnership & consistent public policy Development focus with informal public/private networks 5- years indicative planning: consistent policy framework IDA, Enterprise Ireland, Regional planning Three pillars in the implementation: Cheap production strategy: taxation, EU structural policy Selective FDI: High tech based FDI, export oriented; not for domestic demand Skilled and flexible labor, upgrading, connecting D:\533567381.doc Seite 4 von 19 The role of government: Development planning of the competitive environment Consistent strategy, not firm targets or industry targets 1958: National Development Strategy shift: from forbidding to encouraging MNE 1985: 1st comprehensive plan Structural targets: selective policy in favor of 3 C's Computers Communication (call centers) Chemicals (largest industry; incl. Pharma 1/3 % of value added) Ex post evaluations of Industrial Policy 1982 Telesis Report 1992 Culliton Report Education and training, R&D Infrastructure, taxes Education and training, R&D. Infrastructure, taxes Cluster formation recommended D:\533567381.doc Seite 5 von 19 Some prudent measures of Irish Industrial Policy: Fiber optic lines to all European centers (call center location) National Linkage Program 1985 IDA enforces backward linkages of MNE firms Forbait (Enterprise Ireland) supports SME's Indigenous firms have to prove export base to get grants High profile headquarters and R&D activities in Irish subsidy a priority of NDP Incomes from patents developed in Ireland are tax free (Tobin 1997) Measures in Irish regional policy: All regions have development plans And make use of domestic and EU subsidies (contrast to Italy) Investment grants are contingent on value added and intangibles Dublin, Cork, Waterford, Galway (ports) Galway in the North West: Silicon Valley Shannon center for MNE Belfast industrial center D:\533567381.doc Seite 6 von 19 The importance of FDI Inward FDI investment/ GNP Flow 2000: 22% of GDP 7% in EU 6% in Spain Share and characteristics of MNE 16% of firms 47% of manufacturing employment 91% of exports foreign owned 40% of GDP produced by MNE 88% of Irish MNE production is exported The selectivity of Irish FDI policy: No FDI in labor intensive industries Leading EU location for high-end US FDI in electronics 33% of PCs sold in Europe are from IRE 40% of PC software, 60% of business application produced in IRE 9 of top 10 pharmaceutical companies have plants in Ireland 10 out of 15 medical device companies D:\533567381.doc Seite 7 von 19 The role of FDI and the European Integration FDI - Type: greenfield investments for re-export Locations advantages Institutional credibility (well organized development agency) Financial incentives: Low costs, taxes, cheap loans Skills (technical, local entrepreneurs, English language) Low transport costs (via sea and towards non European countries) Negligible local market Export based production No fear of substitution of local firms Greenfield + export orientation D:\533567381.doc Seite 8 von 19 History: Ireland had not always been open for FDI: Pre 1950 anti FDI approach: prohibition of foreign ownership (incl. UK firms) protection of incipient industry (infant industry argument) a few tariff jumping MNE Policy change in 1958: Economic Development 1st comprehensive national plan Abolishion of Control of Manufacturers Plan Shannon Airport Development Company Aggressively enforcing inward FDI D:\533567381.doc Seite 9 von 19 Role of European integration Membership 1973 Large share of regional and structural funds Used actively for upgrading regions (contrast to Italy) Continued proactive role of national government (contrast to Greece) Ireland most pro active industrial policy (Ruane 1999) Hands on micro dirigism (Ruane and Görg 1999) Incentives tied to employment and R&D content Upfront payments with repayment if target were not fulfilled High tech favored Clusters: the three C's EU demands less distorting rules for attracting investment Tax exemption for MNE Tax differentiation manufacturing / other industries D:\533567381.doc Seite 10 von 19 Examples for large MNE In ICT- industries Intel: 4000 employees, building 3rd wafer fabric Dell: 5000 employees, regional center for EU, Middle East, Africa IBM: 3000 employees, support, software, global e-procurement Hewlett Packard: 2000 employees, manufacturing, banking, e.business Microsoft: 2000 employees, product development, internet hosting In Healthcare and Pharmaceuticals Production and exports of blockbusters like Lipitor and Viagra Production sites for cardiac, optical, orthopedic devices 2 recent success stories in 2002: Wyeth Medica decides to build largest bio-pharma plant ever Microsoft buys NAVISON for 1.5 bn Euro as entry into European software market Largest Irish Firms: CRH Bank of Ireland Allied Irish Bank Smurfit Irish Life and Permanent D:\533567381.doc Seite 11 von 19 Cheap production strategies EU Structural funds 3% of GDP in early 90s, 2% in late 90s Taxes: profit tax waived for MNE 1982 10% for manufacturing; 28% for other firms tax will increase to 12.5% (starting in 2003) but 10% remains for existing firms up to 2010 remind: tax is 35% for other European countries Social partnership lead to moderate wage increases and Enabled a consensus that high profits of MNE are positive Profits make up 40% of GDP Wages 24% below EU average (2000) Wages make up only 26% of value added (1998; EU 52%) Unit labor costs have fallen by 44% in nineties Productivity increase not fully reflected in wages A policy which may change and is not fully optimal At the verge of a knowledge based economy Result: Share of manufacturing in GDP increases in Ireland from 34% to 40% Growth of output in nineties: 8% p.a. In contrast to declining share of manufacturing in all industrialized countries And less than 20% in the US D:\533567381.doc Seite 12 von 19 Education and Skills: the method to attract technological firms and to induce them to upgrade plants Highest rate of investment in human capital between 1960-1985 according to Mankiw, Romer, Weill 1992 7 universities, many colleagues 60% of students in business and science 2nd highest education outlays (after Finland) 57% of graduates in engineering, science, compute, business Media lab Europe (sister of MIT Media Lab) Result: Ireland evaded the development trap Is not hooked on subsidies if they decrease D:\533567381.doc Seite 13 von 19 Growth drivers: Research increasing but below EU average 60% of research expenditure by MNE first only “peripheral R&D” in Ireland now attempts of “upgrading” (Amin et 1994 new functions) Excellent education Technology diffusion Asset for the future: Young and increasing population 40% are younger than 26 yr.; 30% in EU Pensions costs/GDP 3% in 2040 Between 12% and 18% in other countries (max I, D, SF) OECD, FT 23 11 99 Liability: Low domestic savings ratio Currently not binding due to high inward FDI D:\533567381.doc Seite 14 von 19 The National Development Plan (NDP) 20022006 Focus at the policy shift needed When Ireland passes European average And subsidies and cheap production strategies have to be abandoned Investment of over EUR 52 bn over the period 2000-2006 in health services, social housing, education, roads, public transport, rural development, water and waste services. Now 90% from domestic sources EU will contribute EUR 6 bn EUR 3.8 bn from the Structural and Cohesion Funds EUR 2.2 billion under the Common Agricultural Policy (CAP) Rural Development Plan Shift to research and education www.ndp.ie Science foundation Ireland www.sfi.ie New policy become necessary recently wage restraint became more difficult knowledge based society needs skills and training immigration of skilled people benchmarking of public sector payments initiative for 3rd level research capability D:\533567381.doc Seite 15 von 19 Ireland as seen from Theory: Dynamic specialization against H-O model Export oriented FDI Catching up faster than 2% rule Catching up and forging ahead in productivity High investment without high savings Skills and Research in underdeveloped economy Foreign investment lead to growth, Ireland escaped from development trap Ireland as seen from policy strategies: Policy plans in market economy Incomes policy: social partners coordinated with government Prudent industrial and regional policy Determined not to be “the poor's corner” D:\533567381.doc Seite 16 von 19 Status 2002: Productivity no 4 in world (after B, US, I) Highest labor productivity in manufacturing in EU High unit value of exports High share of technology driven industries Productivity higher, wages lower than EU average GDP per head (domestic value added) above EU GSP (Income per head) lower GSP/GDP 80%; difference profit flow to MNE Asset price inflation (mortgage lending, house prices) Infrastructure deficit in some regions D:\533567381.doc Seite 17 von 19 Summing up: no miracle but economic success based on Openness and economic integration Prudent, active, cooperative institutions Selective FDI, low costs and skills And the knowledge that the factors defining success will change Final question marks: Celtic Bubble or Celtic Tiger? Will the process continue ? Is a BSP 20% below BIP sustainable ? Part of BIP extra profits and transfer prices Is it sustainable that own investment is low (and complemented by FDI?) Inflationary pressure increases (EU ) Crowding out of indigenous firms via wage increase (input market) What happens if cheap production strategy and structural funds are lost ? The coherence of the society, the prudent planning and the determinedness of the people together with investment in research, education and new technologies Favor a continued growth scenario (however at a smaller difference to Europe) D:\533567381.doc Seite 18 von 19 References: Sean Dorgan: Competitiveness in the Science Based Economy, WIFO Symposioum, Vienna 2002 Paul Tobin: Ireland Dublin, 1999 Denis O`Hearn: Inside the Celtic Tiger: the Irish Economy and the Asian model” London, Sterling, 1998 Frank Barry (ed) Understanding Irelands Economic Growth, Basingstroke London 1999 Ana Tavares: Systems, Evolution and Integration: Modelling the Impact of Economic Integration on Multinationals’ Strategies’. PHD Dissertation, University of Porto A. Tavares: ‘The Dialectic Between Regional and Corporate Integration: The Impact of the Single Market Programme on the Strategic Orientation of Multinational Enterprises, with an Application to the Portuguese Case’. A. Tavares: ‘Multinational Subsidiary Evolution and Public Policy: Two Tales from the European Periphery’ Journal of Industry, Competition and Trade (2002), forthcoming. Robert J. Barro und Xavier Sala-I-Martin „Convergence across States and Regions" Brookings Papers on Economic Activity 1: 1991, S. 107-182. Eurostat/EU-Kommission „Europäische Wirtschaft„ Nr.70, 2000, S. 186f. Tim Callan und Brian Nolan „Income Inequality in Ireland in the 1980s and 1990s" in Frank Barry (ed.) „Understanding Ireland’s Economic Growth" Basingstoke/London 1999, S.176. Europäische Kommission „Einheit Europas, Solidarität der Völker, Vielfalt der Regionen. Zweiter Bericht über den wirtschaftlichen und sozialen Zusammenhalt – Statistischer Anhang„ Brüssel 2001, Tabelle A2. Paul Sweeney „The Celtic Tiger. Ireland’s Continuing Economic Miracle" Dublin 1999, S.37 EU Kommission „Sechster Periodischer Bericht über die sozioökonomische Lage der Regionen der Europäischen Union„, Brüssel 1999, S. 221 Denis O’Hearn „Inside the Celtic Tiger. The Irish Economy and the Asian Model" London/Sterling 1998, Bart van Ark und Robert H. Mc Guckin „International comparisons of labor productivity and per capita income„ Monthly Labor Review July 1999, S. 36 European Commission „The Economic and Financial Situation in Ireland: Ireland in the Transition to EMU" special issue of European Economy 1996 (zitiert bei O’Hearn, S.85). Wirtschafts- und Sozialausschuss der EU (CES) „Opinion of the Economic and Social Committee on The EU Economy 1999: Review" 369/2000, Appendix „Ireland: An Example of Economic Policy Success" D:\533567381.doc Seite 19 von 19

